
Use this report to:
- Performance Evaluation: Analyzing sales by Salesperson allows to evaluate the performance of individual sales team members. This data can help identify top performers, areas for improvement, and training needs.
- Incentive Programs: design and implement effective incentive programs for the sales team. By tracking individual sales performance, you can tailor incentive structures to reward top performers, boost motivation, and drive sales growth. This can lead to increased productivity, higher sales numbers, and improved overall team morale.
- Sales Strategy Optimization: Analyzing sales by Salesperson provides valuable insights into the effectiveness of different sales strategies and techniques. By identifying which approaches are most successful for each salesperson, you can optimize their sales processes, training programs, and resource allocation. This data-driven approach can lead to more targeted and efficient sales efforts, ultimately driving higher revenue and profitability.
Navigate to Reports →Sales → Sales by Representative.
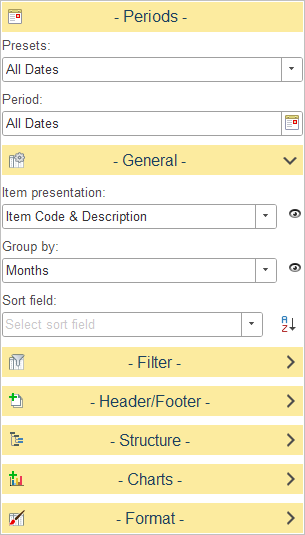
Availables settings:
The General settings panel allows users to configure the display and organizational preferences for the Sales by Representative report.
- Item presentation: Defines how inventory items are identified within the report. Users can select to display the Item Code, Item Description, or a combination of both (Item Code & Description).
- Group by: Determines the temporal aggregation of sales data. This setting allows users to group transaction data by specific time intervals, such as Days, Weeks, Months, Quarters, Years, Total to facilitate trend analysis and period-over-period comparisons.
- Sort field: Enables users to choose the criteria by which the report data is ordered. Once a field is selected from the dropdown menu, the data can be sorted in either ascending or descending order using the adjacent toggle icon.
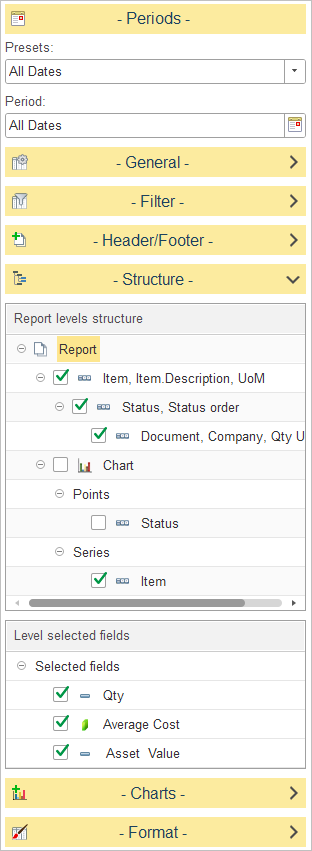
In Report levels structure, select how inventory data is grouped in the report.
This section allows for the configuration of both tabular data and graphical output.
- Table: Organizes report data into a structured format.
- Table: Organizes report data into a structured format.
- Rows: Defines the vertical grouping of data. Users can group by Department, then by individual Sales Person, and include for granular transaction insight.
- Chart: Configures visual data representation.
- Points: Sets the basis for chart plotting.
- Series: Configures data series, with the Sales Person field available to visualize individual performance metrics graphically.
To customize the report structure, expand the Structure section and select or clear the checkboxes next to each level to include or exclude it from the report hierarchy. You can also drag and drop levels to change the order in which data is grouped.
The Level selected fields section allows you to configure which data points are included as columns in your report. The following fields are available for selection, regardless of their current status in the screenshot:
Dimensions and Attributes
- Grouping Period: Displays the time interval (e.g., months, quarters) used to categorize sales data over time.
- Item: Identifies the specific product or service sold.
- Lot: Displays the lot number associated with the inventory item.
- Sales Person: Identifies the representative responsible for the transaction.
- Department: Shows the organizational department associated with the sale.
- Location: Specifies the physical or business location where the sale originated.
- Sales Transaction: Provides a reference to the specific sales document or entry.
- Recorder: The name of the document confirming financial transaction.
- Class: An additional classification related to the sale’s category.
- Project: Association with any specific project, if applicable.
- Sales Order: Displays the associated sales order number for the transaction.
- Consignment Sale: Indicates whether the transaction was processed as a consignment sale.
- Dropship Sale: Identifies whether the transaction was fulfilled via a dropship process.
Financial Performance Metrics
- Revenue: Displays the total income generated from the sale.
- Gross Sales: Shows the total value of sales before any deductions or adjustments.
- Discount Amount: Displays the total monetary value of discounts applied to the transaction.
- Cost of Sales: Represents the direct costs incurred to generate the sale.
- Gross Profit: Displays the profit calculated by subtracting the Cost of Sales from the Revenue.
- Gross Margin: Shows the profitability of the sale as a percentage of revenue.
- Cumulative Revenue: Displays the running total of revenue accumulated over the reporting period.
- Cumulative Gross Profit: Displays the running total of gross profit accumulated over the reporting period.
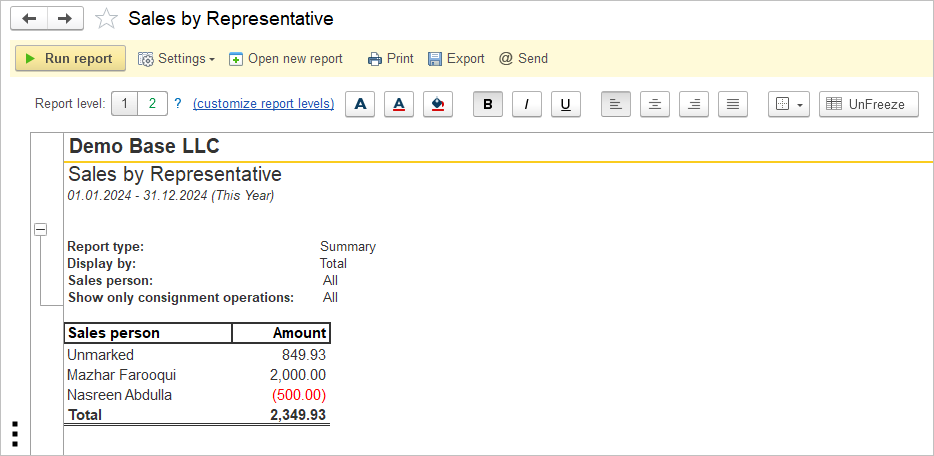
Other sales reports available for performance analysis include Sales by Customer, Sales by Item and Sales by Location.