
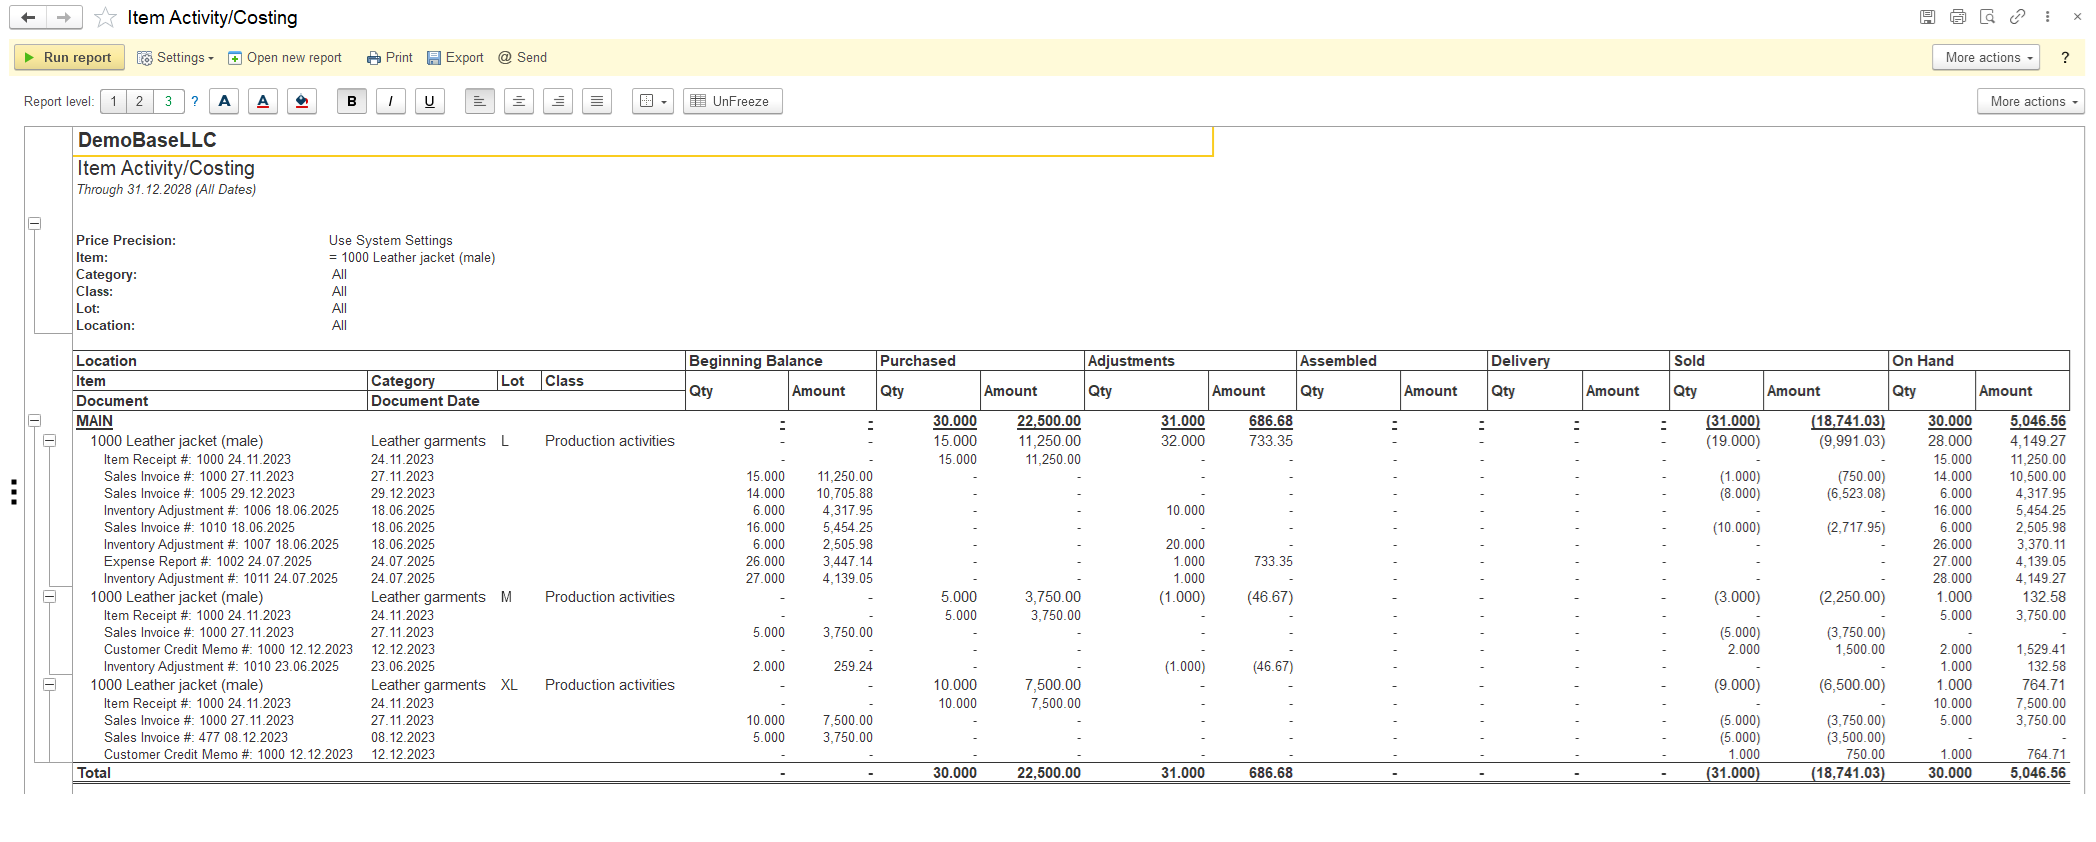
The Item Activity/Costing report provides a detailed, chronological history of inventory movements and their associated financial impact for selected items over a defined period.
Navigate to Reports → Inventory → Item Activity/Costing.
This report serves as a centralized tool to analyze the lifecycle of inventory, addressing key operational questions:
- Inventory Origins: Tracks the beginning balance and all incoming stock (purchases).
- Inventory Usage: Details adjustments, assembly/disassembly activities, and deliveries to customers.
- Current Position: Calculates the ending balance and provides a valuation of remaining stock.
- Financial Impact: Displays both quantities and monetary costs for every transaction type.
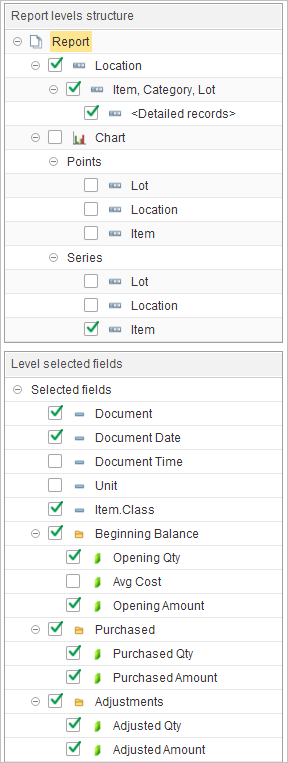
Report Levels Structure
This section defines how the report data is aggregated and visualized.
Hierarchical Grouping: Users can configure the reporting hierarchy by toggling and arranging levels, such as Location, Item, Category, Lot, and to drill down into specific transactions.
Charts: When enabled, the Chart section allows for visual data representation.
- Series: Configures the data series for the chart (e.g., Lot, Location, or Item).
- Points: Defines the data points to be plotted in the chart (e.g., Lot, Location, or Item).
The Level Selected Fields section allows for comprehensive inventory and financial reporting. Below are descriptions for all available fields, categorized by their function:
Document and General Information
- Document: The unique identifier for the transaction record.
- Document Date: The date on which the transaction occurred.
- Document Time: The specific time the transaction was recorded.
- Unit: The unit of measure used for the item.
- Item.Class: The class or category grouping assigned to the item.
Inventory Metrics by Category
Each category includes specific quantity and monetary fields to track stock movement.
- Beginning Balance:
- Opening Qty: The quantity held at the start of the period.
- Avg Cost: The average cost per unit at the beginning of the period.
- Opening Amount: The total monetary value of the opening stock.
- Purchased:
- Purchased Qty: Total units received from vendors.
- Purchased Amount: The total cost value of purchased units.
- Adjustments:
- Adjusted Qty: Net units added or removed via adjustments.
- Adjusted Amount: The financial value of these adjustments.
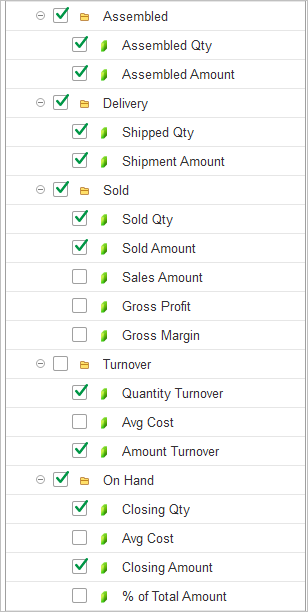
- Assembled:
- Assembled Qty: Net units produced or disassembled.
- Assembled Amount: The financial value associated with assembly/disassembly.
- Delivery:
- Shipped Qty: Units fulfilled and shipped to customers.
- Shipment Amount: The total cost value of shipped inventory.
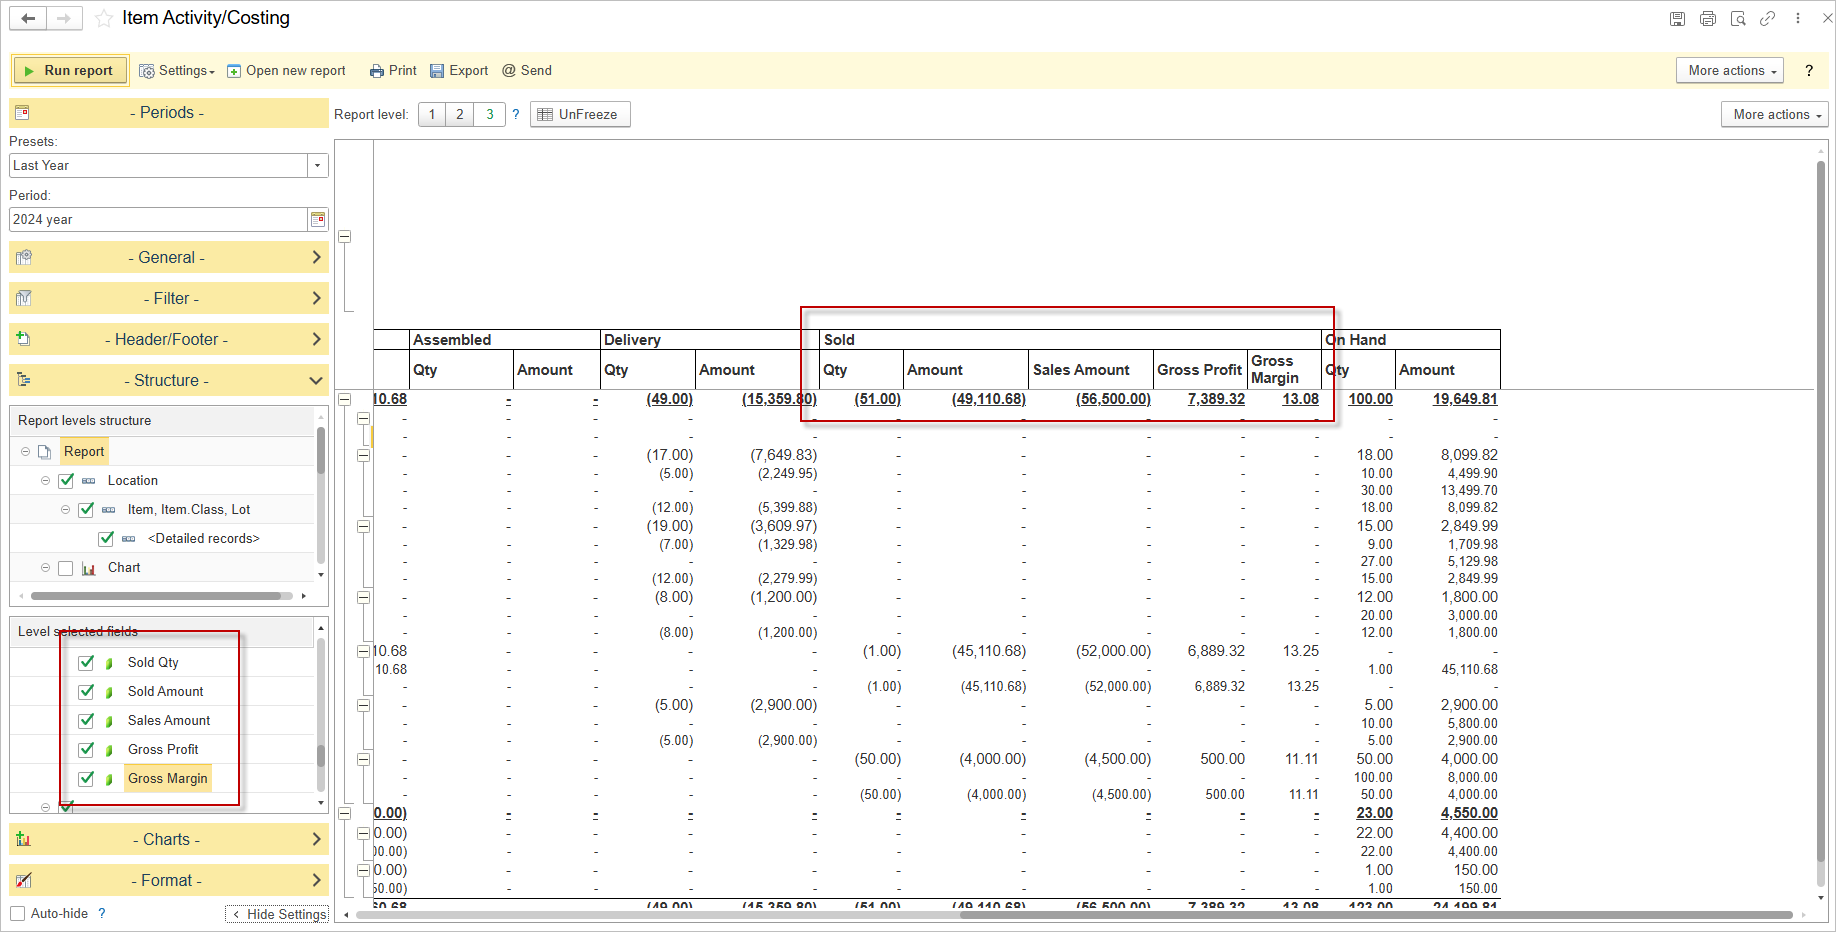
- Sold:
- Sold Qty: Total units sold.
- Sold Amount: The total cost value of the sold units.
- Sales Amount: The total revenue generated from sales.
- Gross Profit: The profit calculated after deducting COGS.
- Gross Margin: The profitability percentage for the item.
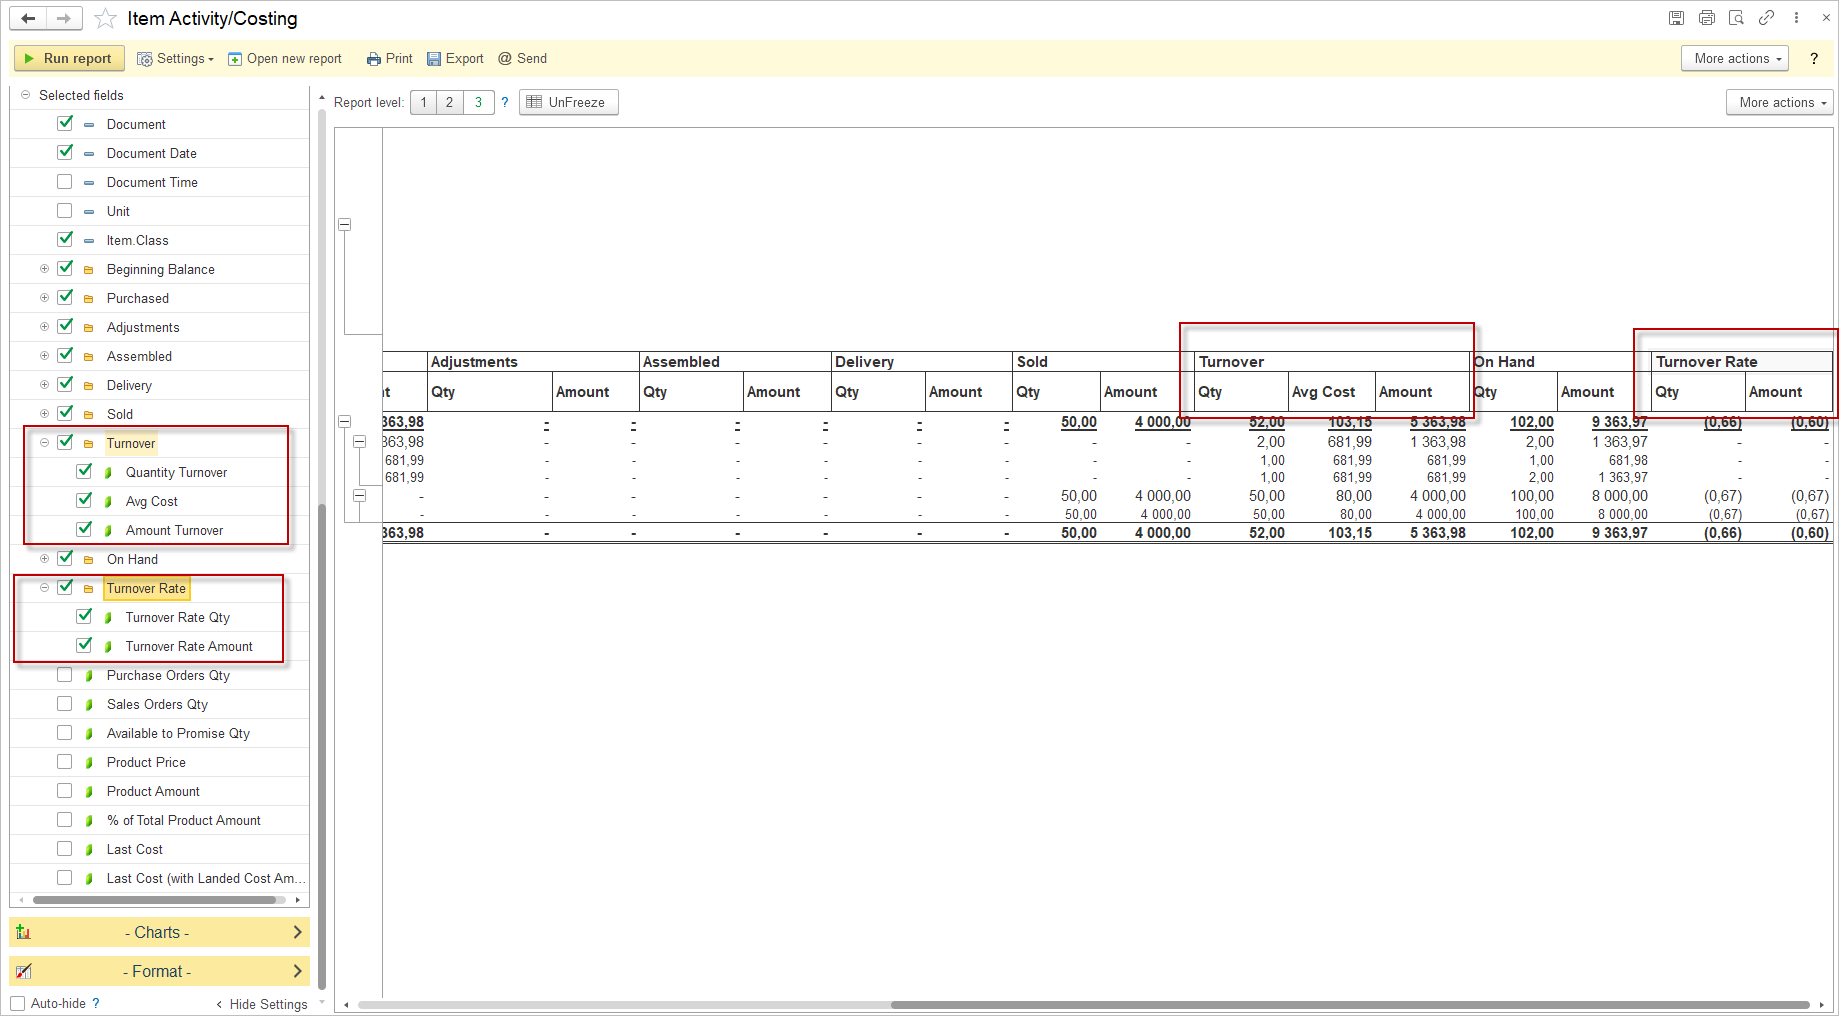
- Turnover:
- Quantity Turnover: The total volume of movement during the period.
- Avg Cost: The average cost during the period.
- Amount Turnover: The total financial movement during the period.
- On Hand:
- Closing Qty: The remaining quantity at the end of the period.
- Avg Cost: The final average cost per unit.
- Closing Amount: The total financial value of remaining inventory.
- % of Total Amount: The percentage that this item’s value contributes to the total inventory value.
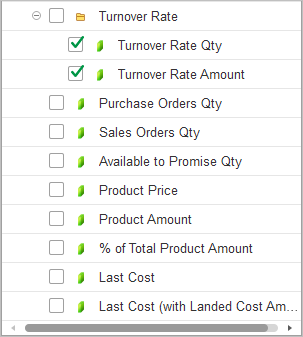
- Turnover Rate:
- Turnover Rate Qty: The rate inventory is sold and replaced over a period, calculated as Sold Qty ÷ Average Inventory Qty.
- Turnover Rate Amount: The rate inventory value turns over during a period, calculated as Sold Amount ÷ Average Inventory Amount..
Supplementary Analytical Fields
- Purchase Orders Qty: Quantity expected from vendors.
- Sales Orders Qty: Quantity reserved for customer orders.
- Available to Promise Qty: Uncommitted inventory available for new orders.
- Product Price: Current selling price per unit.
- Product Amount: Total value calculated as quantity multiplied by price.
- % of Total Product Amount: Percentage of the product’s value relative to total stock.
- Last Cost: The most recent purchase price per unit.
- Last Cost (with Landed Cost Amount): The most recent purchase price including landed costs.
Analytical Applications #
The report is essential for several core business functions:
Financial Accounting
- COGS Calculation: Provides valuation data required for determining the Cost of Goods Sold.
- Inventory Valuation: Supplies figures necessary to value ending inventory on the balance sheet.
- Auditability: Maintains a clear, auditable trail of all inventory transactions for compliance purposes.
Inventory Control
- Shrinkage Identification: Enables managers to compare theoretical stock (Opening + Purchased) against actuals to detect losses.
- Traceability: Supports lot-level tracking for quality control and product recalls.
Supply Chain Management
- Replenishment: By monitoring sales velocity and production usage, purchasing managers can optimize order timing and quantities.
Advanced Metrics and Turnover Analysis #
Users can customize the report to include advanced performance indicators, including Available to Promise (ATP) Qty, Last Cost, and various Turnover metrics.
Turnover Calculations:
- Turnover Qty & Amount: Indicates whether inventory is increasing (purchases exceed sales) or decreasing (sales exceed purchases).
- Turnover Rate: Measures how efficiently inventory is sold and replaced. A high turnover rate (>1) generally indicates fast-moving stock, while a low rate (<1) suggests slower demand.
Turnover Rate Interpretation
| Value | Interpretation |
|---|---|
| 0 | No sales during the period |
| >0 to <1 | Sold less than the average inventory (low turnover) |
| =1 | Sold exactly the same quantity as the average inventory (or had zero purchases and sold all existing stock) |
| >1 | Sold more than the average inventory (high turnover, fast-moving item) |
| Negative | Returns exceeded sales during the period |
Turnover Qty and Amount Interpretation
| Turnover Qty | Turnover Amount | Interpretation |
|---|---|---|
| Positive (+) | Positive (+) | Purchases exceeded sales in both quantity and cost — inventory increased |
| Positive (+) | Negative (-) | Purchased more units than sold, but sold inventory had higher cost basis (COGS > Purchases) — inventory value decreased despite quantity increase |
| Negative (-) | Positive (+) | Sold more units than purchased, but purchased inventory had higher cost basis — inventory value increased despite quantity decrease |
| Negative (-) | Negative (-) | Sales exceeded purchases in both quantity and cost — inventory decreased |
| Zero (0) | Zero (0) | No inventory movement during the period |
| Zero (0) | Positive (+) | Purchases equaled sales in quantity, but purchase cost exceeded COGS — inventory value increased |
| Zero (0) | Negative (-) | Purchases equaled sales in quantity, but COGS exceeded purchase cost — inventory value decreased |

Current Limitation in the Item Costing Report
The Item Costing Report currently has a limitation related to the display of Amounts per product within a single transaction. If a transaction contains two or more lines with the same product but with different Prices or Lots, the report will not show the exact Amount for each individual line. Instead, it will display the average Amount for that product within the transaction.
All technical details and configuration instructions for the Report can be found in the dedicated section titled Report Form.