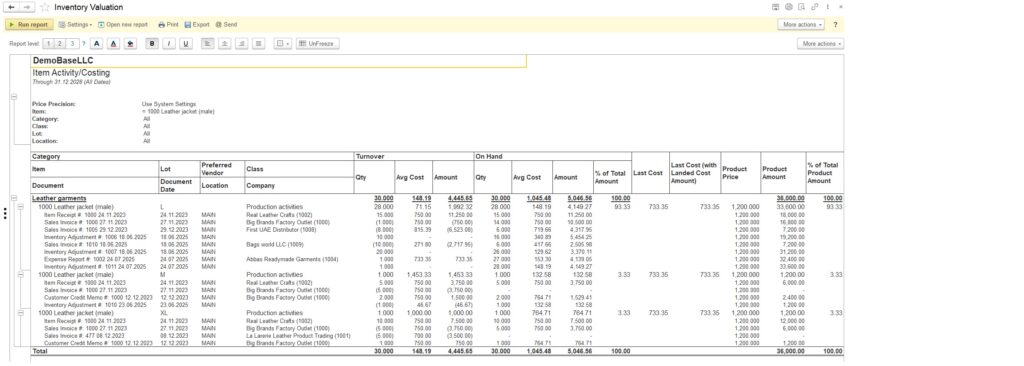
By analyzing the inventory valuation report, you can gain valuable insights into the cost structure of your inventory, helping you make informed decisions on pricing strategies and cost control measures to maximize profitability.
Understanding the percentage of total value and total retail value in the report allows you to assess the overall financial health of your inventory, identify high-value items, and prioritize inventory management efforts to optimize cash flow and drive business growth.
Navigate to Reports → Inventory → Inventory Valuation
Structure #
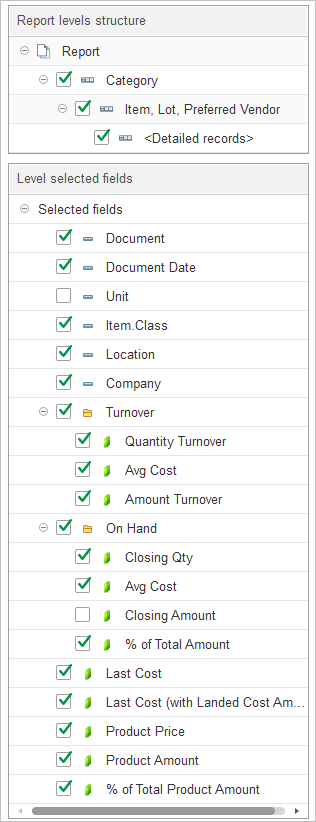
In Report levels structure, select how inventory data is grouped in the report.
The default report structure groups data as follows:
- Category – Groups inventory items by their assigned inventory category.
- Item, Lot, Preferred Vendor – Displays each inventory item together with its lot number and preferred vendor.
- Detailed Records – Displays every inventory transaction affecting the selected item and lot, including the document, transaction date, location, and company.
To customize the report structure, expand the Structure section and select or clear the checkboxes next to each level to include or exclude it from the report hierarchy. You can also drag and drop levels to change the order in which data is grouped.
In Level selected fields, choose which columns are displayed for the selected report level.
The available fields include:
- Document – Displays the inventory transaction document.
- Document Date – Displays the date of the inventory transaction.
- Unit – Displays the unit of measure for the inventory item.
- Item Class – Displays the item’s classification.
- Location – Displays the warehouse or inventory location associated with the transaction.
- Company – Displays the customer, vendor, or other business partner related to the transaction.
The report also provides inventory valuation fields grouped into Turnover and On Hand sections:
Turnover
- Qty – Displays the transaction quantity.
- Avg Cost – Displays the average unit cost applied to the transaction.
- Amount – Displays the total value of the inventory transaction.
On Hand
- Closing Qty – Displays the inventory quantity on hand at the end of the selected reporting period.
- Avg Cost – Displays the average unit cost of the inventory remaining on hand at the end of the reporting period.
- Closing Amount – Displays the total value of the inventory on hand at the end of the reporting period.
- % of Total Amount – Displays the percentage that the item’s closing inventory value represents of the total inventory value shown in the report.
Additional valuation fields are available:
- Last Cost – Displays the most recent purchase cost of the inventory item.
- Last Cost (with Landed Cost Amount) – Displays the latest purchase cost including allocated landed costs.
- Product Price – Displays the current product price.
- Product Amount – Displays the total value calculated using the product price.
- % of Total Product Amount – Displays the percentage contribution of the item’s product value to the total product value shown in the report.