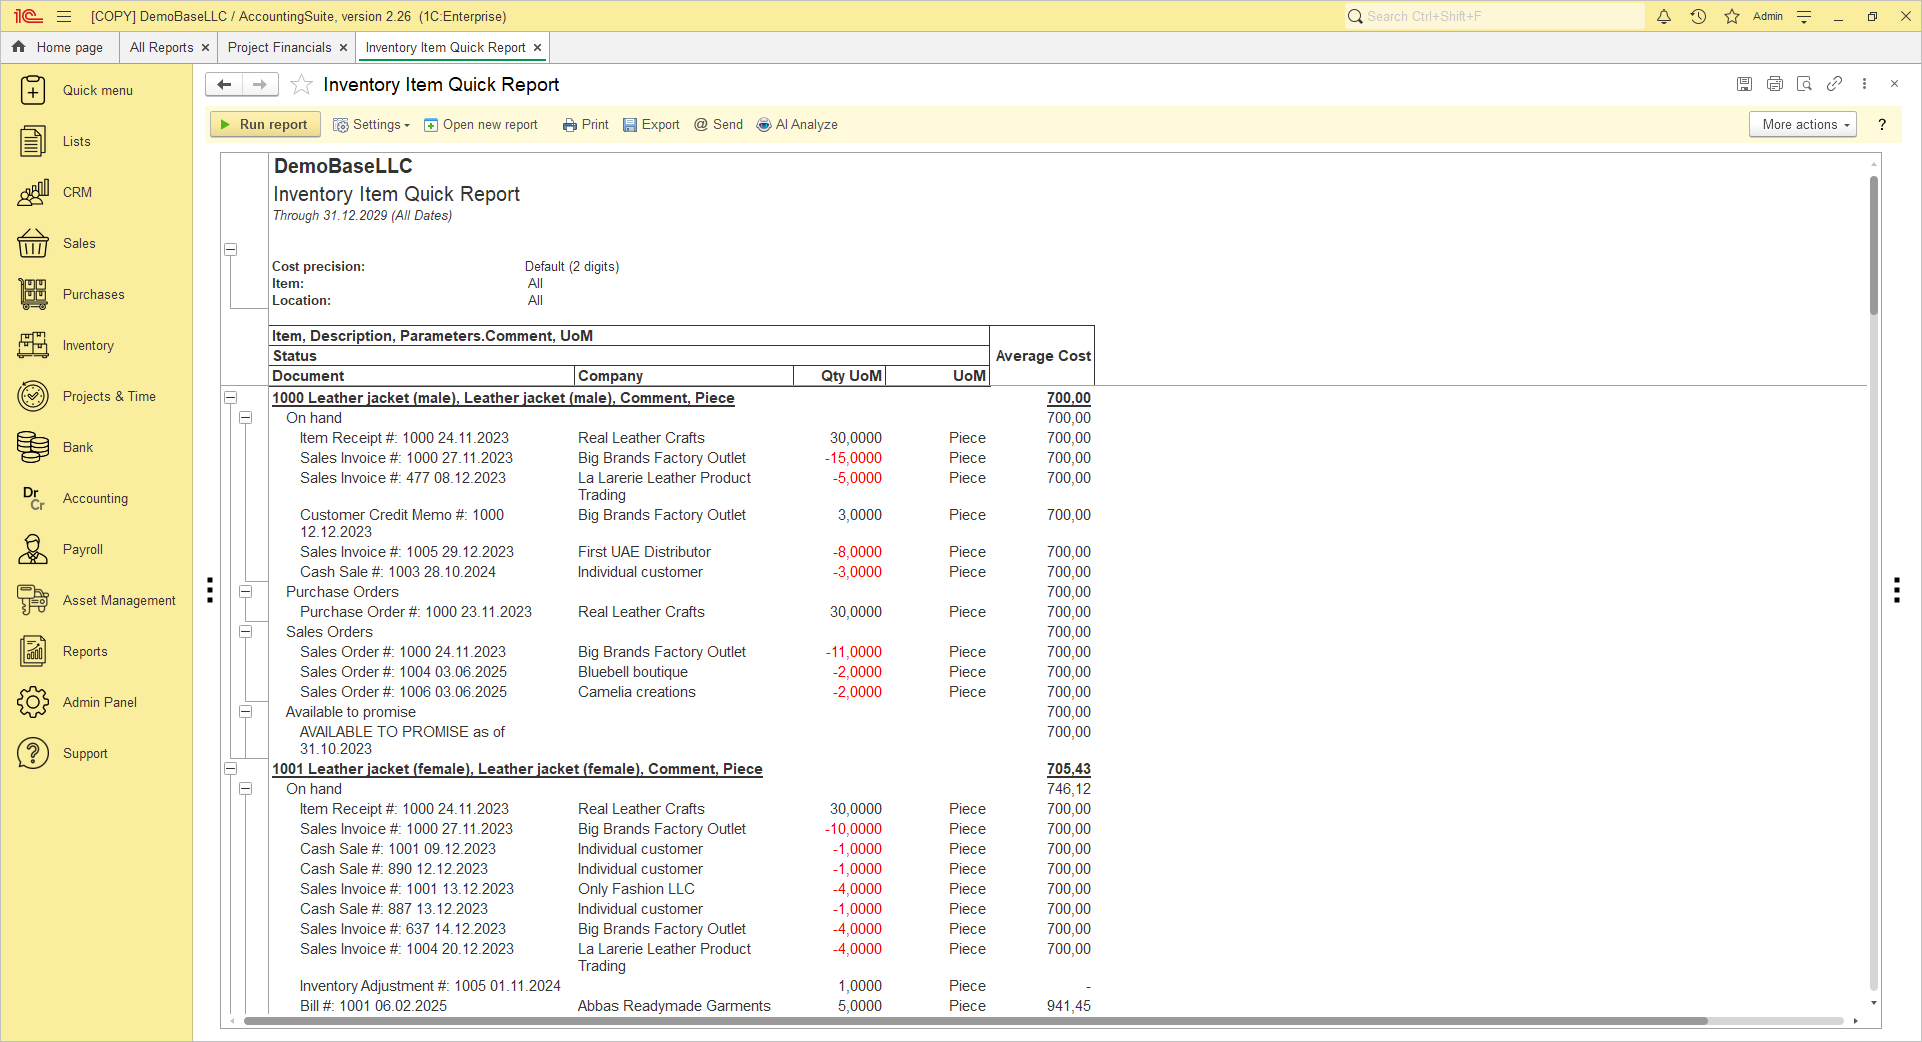
The Inventory Item Quick Report provides a detailed overview of inventory activity for the selected reporting period. It displays inventory balances together with all related inventory transactions for each item, allowing users to trace stock movements, review current quantities on hand, analyze open inventory commitments, and verify the average cost and inventory value of individual items. The report is commonly used for inventory reconciliation, stock analysis, and auditing.
Navigate to Reports → Inventory → Inventory Item Quick Report.
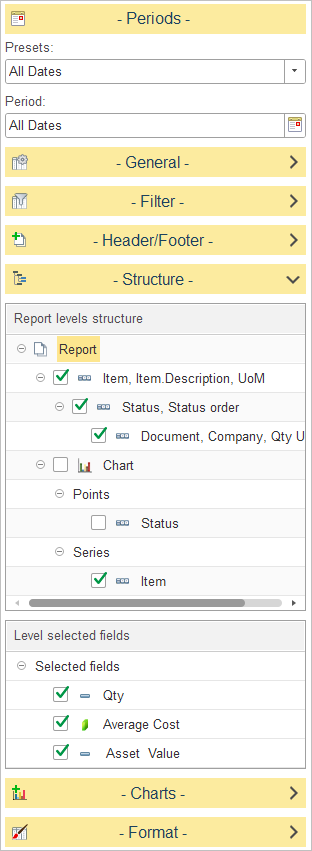
In Report levels structure, select how inventory data is grouped in the report.
The default report structure groups data as follows:
- Item, Item Description, Unit of Measure (UoM) – Displays each inventory item as the primary grouping level.
- Status – Groups inventory information by transaction status, such as On Hand, Purchase Orders, Sales Orders, and Available to Promise.
- Document – Displays the individual inventory transactions within each status, including the document number, business partner, transaction quantity, and unit of measure.
The report also includes Chart settings, where Status can be used as chart points and Item as chart series for graphical analysis.
To customize the report structure, expand the Structure section and select or clear the checkboxes next to each level to include or exclude it from the report hierarchy. You can also drag and drop levels to change the order in which data is grouped.
In Level selected fields, choose which numeric columns are displayed for the selected report level.
The available fields include:
- Qty – Displays the inventory quantity for the selected level or transaction.
- Average Cost – Displays the calculated average cost of the inventory item.
- Asset Value – Displays the total inventory value based on the item quantity and valuation method.