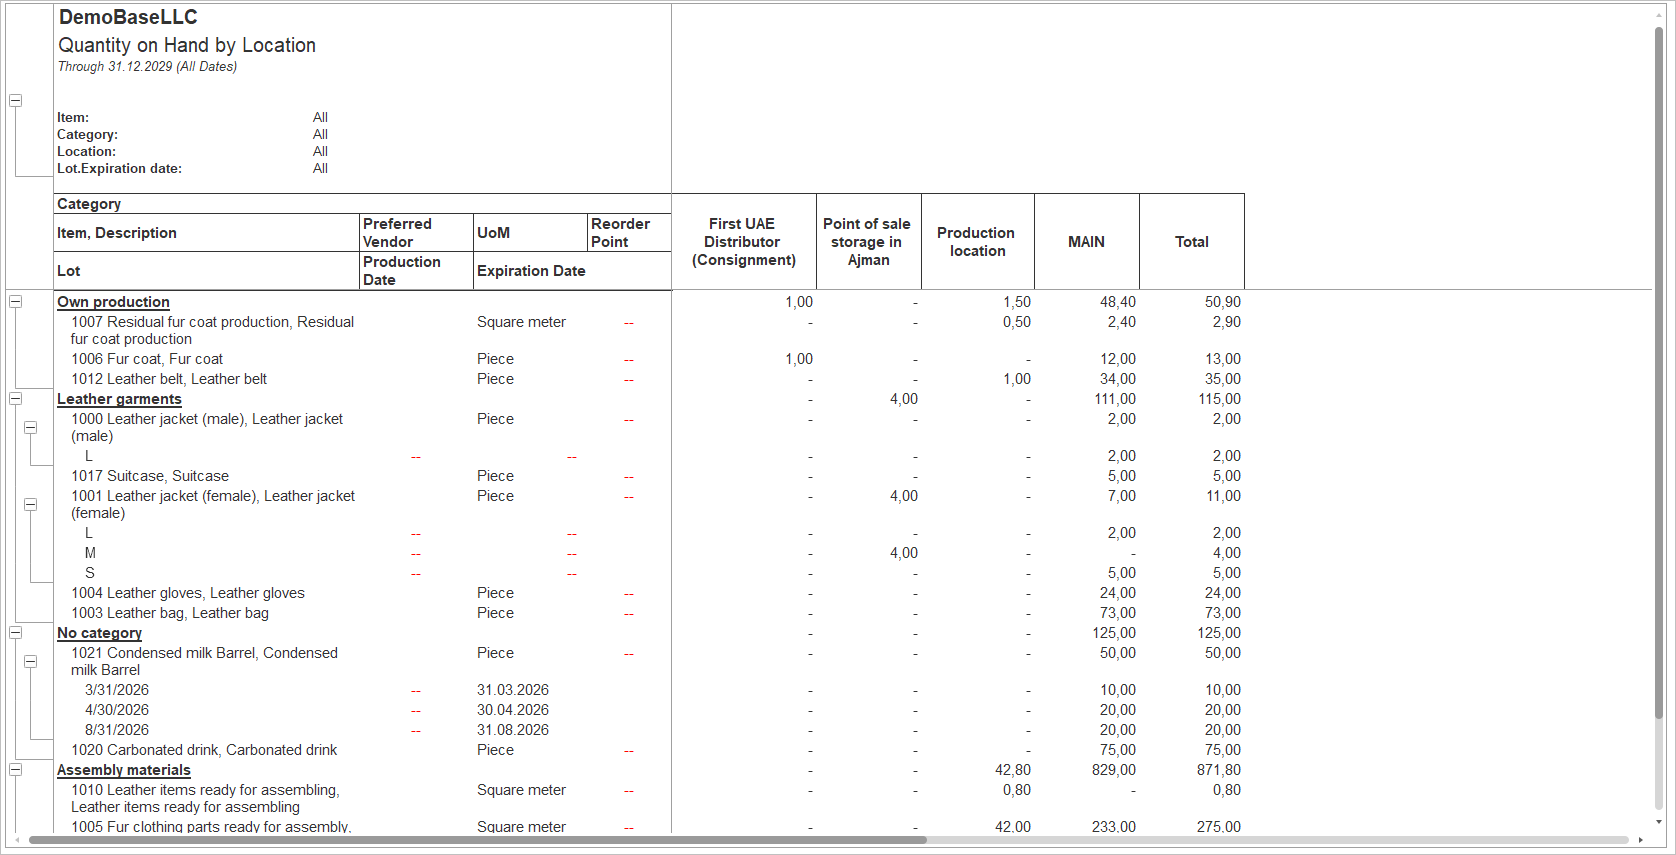
Analyzing the quantity on hand by location is crucial for optimizing inventory levels, ensuring accurate stock counts, and improving operational efficiency. By monitoring inventory quantities at each location, you can maintain inventory visibility, prevent stockouts, plan for Warehouse transfers streamline order fulfillment, and control costs effectively.
Navigate to Reports → Inventory → Quantity on Hand by Location
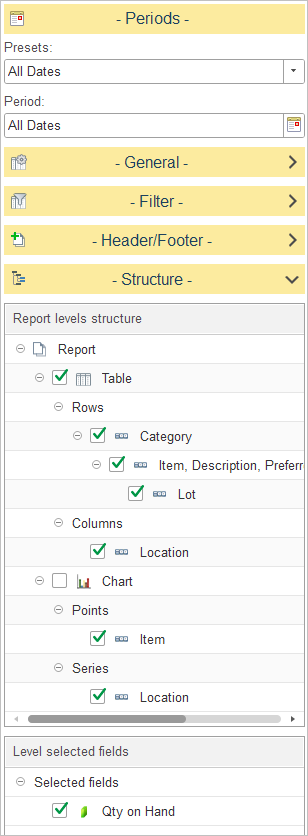
In Report levels structure, select how inventory data is organized in the report.
The report is displayed as a matrix, where inventory items are listed in rows and inventory locations are displayed as columns.
The default structure is configured as follows:
Rows
- Category – Groups inventory items by their assigned inventory category.
- Item, Description, Preferred Vendor, Unit of Measure (UoM), Reorder Point – Displays detailed information for each inventory item.
- Lot – Displays lot numbers for lot-tracked inventory items together with their production and expiration dates.
Columns
- Location – Displays a separate column for each inventory location or warehouse, allowing quantities to be compared across locations.
The report also includes Chart settings, where Item can be used as chart points and Location as chart series for graphical analysis.
To customize the report structure, expand the Structure section and select or clear the checkboxes next to each level to include or exclude it from the report hierarchy. You can also drag and drop levels to change the order in which data is grouped.
In Level selected fields, choose which inventory values are displayed in the report.
The available field includes:
- Qty on Hand – Displays the quantity of inventory currently available at each location, together with the total quantity across all locations.