
The Project Financials report within AccountingSuite provides a comprehensive insight into the financial health of a project, combining income, expenses, profit, profit margin, cash flows, assets, liabilities, and engaged hours into a single and clear picture. It serves as the foundation for efficient project budgeting and financial oversight, enabling users to set clear spending limits and track actual costs against planned budgets. Therefore, the report is used for the following purposes:
- Financial Control – Project budgeting helps maintain financial control by setting clear spending limits and tracking expenses. This ensures that the project stays within budget and avoids overspending, leading to better financial management and decision-making.
- Resource Allocation – By creating a project budget, it is possible to efficiently allocate resources such as funds, manpower, and materials to different tasks and activities. This contributes to optimal resource utilization and ensures that the project progresses smoothly without any resource shortages.
- Performance Evaluation – Project budgeting enables the comparison of actual costs with planned costs, thereby evaluating the project’s performance in terms of cost efficiency. Such analysis helps identify areas for improvement and supports informed decision-making for future projects
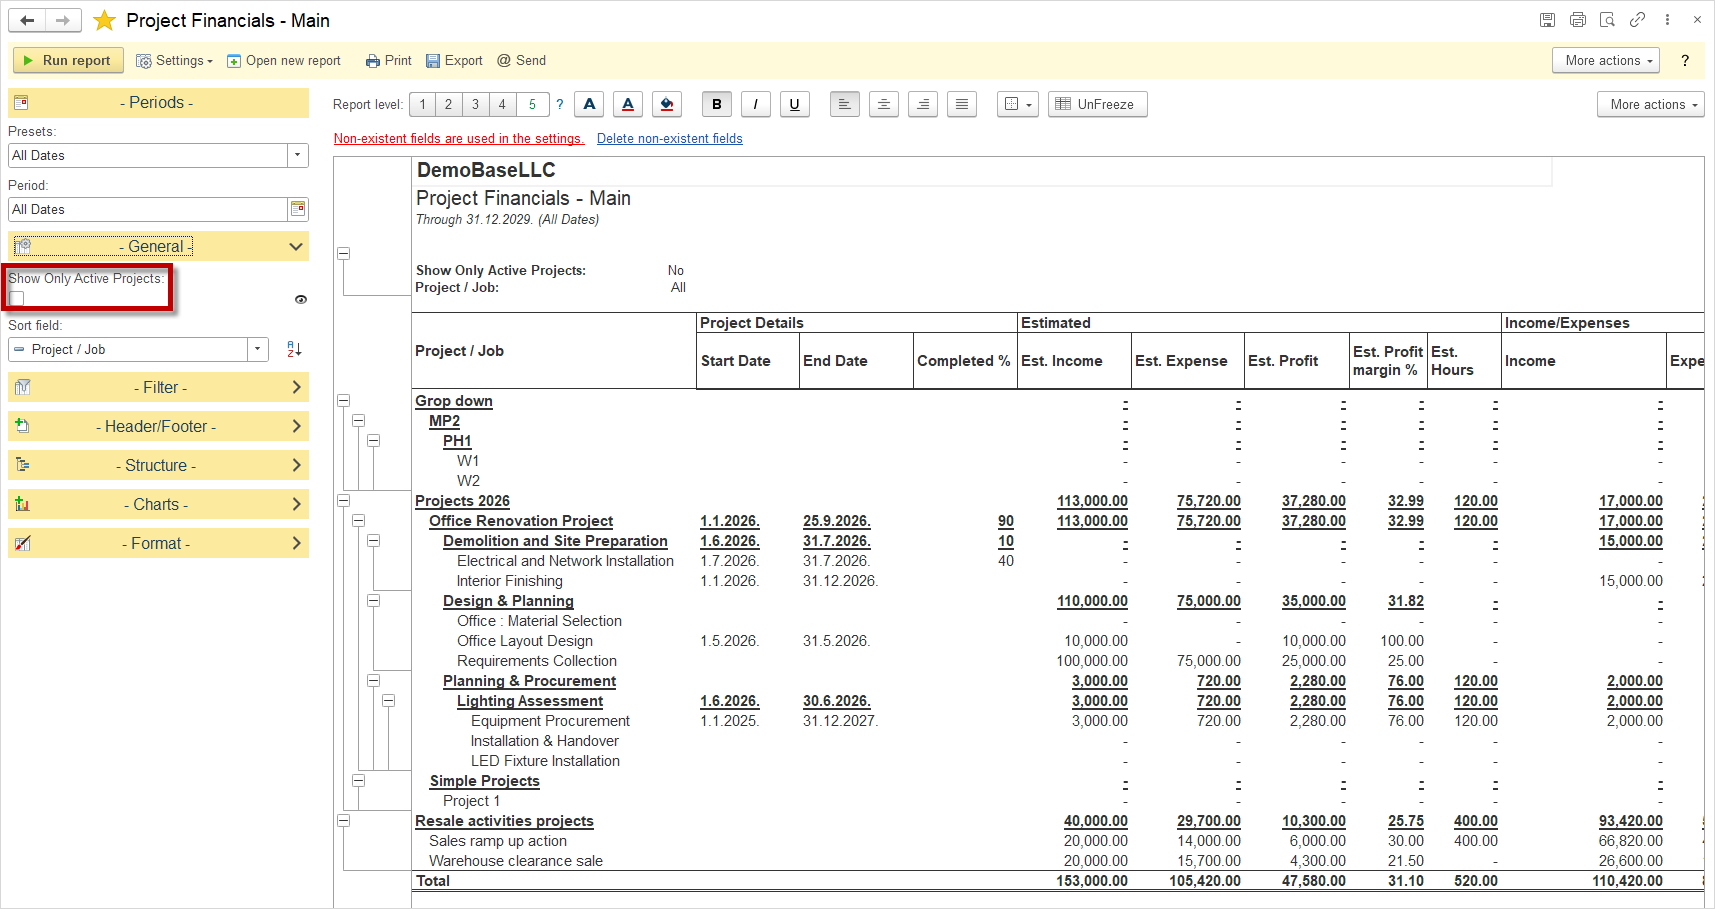
The report provides the Show Only Active Projects option, which is enabled by selecting the checkbox. When this option is enabled, the report displays only active projects, while inactive projects are omitted from the view. This option allows users to focus on projects that are currently in progress and relevant for analysis, thereby simplifying the overview and improving the readability of the report.
When generating the report, the message Non-existent fields are used in the settings. Delete non-existent fields. This message indicates that the report settings contain fields that no longer exist in the system – most often due to configuration changes, updates, or customizations. In order for the report to be displayed correctly, the non-existent fields need to be removed from the report settings. After removal, the report will be generated normally.
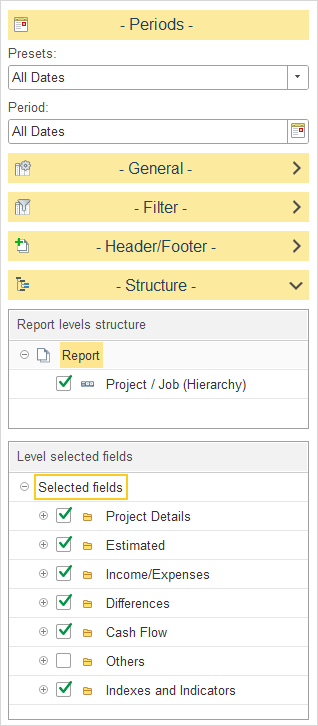
The data in the Project Financial report is displayed according to the project hierarchy: Master Project → Phase → Job. This structure enables an overview of financial data at different levels – from the highest level of the master project, through phases, down to individual jobs.
Within the Level Selected Fields , it is possible to select the fields that will be displayed in the report. In this way, the user tailors the report content to their needs by choosing only the relevant items, thereby achieving greater clarity and efficiency of analysis.
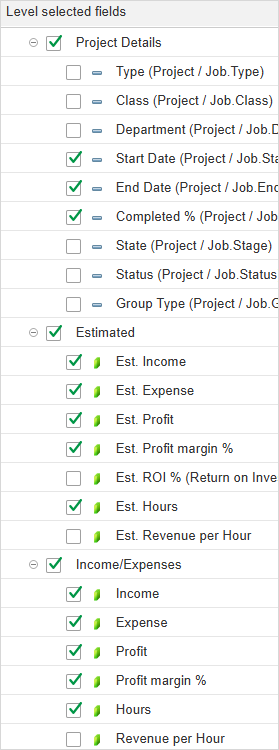
- Project Details:
- Type (Project / Job.Type): The type of the project that defines its primary category.
- Class (Project / Job.Class): The project class used for additional classification.
- Department (Project / Job.Department): The department to which the project belongs.
- Start Date (Project / Job.Start date): The date when the project started.
- End Date (Project / Job.End date): The date when the project was completed or is planned to be completed.
- Completed % (Project / Job.Percent Completd): The percentage indicating how much of the project has been completed.
- Stage (Project / Job.Stage): The current stage of the project.
- State (Project / Job.State): The current status or state of the project.
- Project / Job.Group Type: The group type to which the project belongs.
- Estimated:
- Est. Income: The estimated income expected from the project.
- Est. Expense: The estimated expenses for the project.
- Est. Profit: The estimated profit, calculated as the difference between estimated income and estimated expenses. Formula: Est. Profit = Est. Income – Est. Expense
- Est. Profit margin %: The estimated profit expressed as a percentage of estimated income. Formula: Est. Profit margin % = Est. Profit/ Est. Income * 100%
- Est. ROI % (Return on Investment): The estimated return on investment for the project. Formula: Est. Profit / Est. Expense * 100%
- Est. Hours: The estimated number of working hours required to complete the project.
- Est. Revenue per Hour: The estimated revenue generated per working hour. Formula: Est. Revenue per Hour = Est. Income/ Est. Hours
- Income/Expenses
- Income: The total actual income generated by the project. Formula: Income – Revenue and other Income. Include all accounts associated with the Project and assigned to the Income category. Credit (Cr) is treated as a positive amount, while Debit (Dr) is treated as a negative amount.
- Expense: The total actual expenses incurred by the project. Formula: Expense – COGS and other Expense accounts. Include all accounts associated with the Project and assigned to the Expense category. Debit (Dr) is treated as a positive amount, while Credit (Cr) is treated as a negative amount.
- Profit: The actual profit, calculated as the difference between income and expenses. Formula: Profit = Income – Expense
- Profit margin %: The actual profit expressed as a percentage of income. Formula: Profit margin % = Profit / Income * 100%
- Hours: The total number of working hours recorded for the project.
- Revenue per Hour: The actual revenue generated per recorded working hour. Formula: Revenue per Hour = Income / Hours
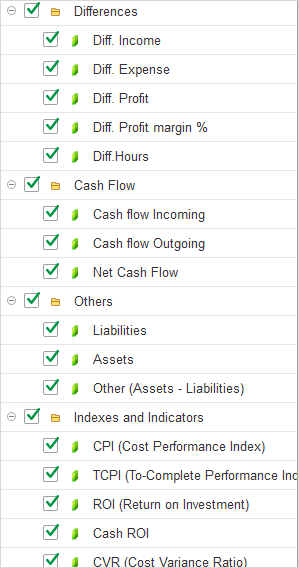
- Differences:
- Diff. Income: The difference between the actual and estimated project income. Formula: Diff. Income = Income – Est. Income
- Diff. Expense: The difference between the actual and estimated project expenses. Formula: Diff. Expense = Expense – Est. Expense
- Diff. Profit: The difference between the actual and estimated project profit. Formula: Diff. Profit = Profit – Est. Profit
- Diff. Profit margin %: The difference between the actual and estimated profit margin expressed as a percentage. Forumala: Diff. Profit margin % = Profit margin % – Est. Profit margin %
- Diff. Hours: The difference between the actual and estimated number of working hours. Formula: Diff. Hours = Hours – Est. Hours
- Cash Flow:
- Cash flow Incoming: The total amount of cash inflows associated with the project. Formula: Include all accounts in the Asset category with a subcategory marked with the Cash Flow checkbox. Include only Debit (Dr) amounts: Debit is treated as positive, while Credit (Cr) is treated as negative.
- Cash flow Outgoing: The total amount of cash outflows associated with the project. Formula: Include all accounts in the Asset category with a subcategory marked with the Cash Flow checkbox. Include only Credit (Cr) amounts: Credit is treated as positive, while Debit (Dr) is treated as negative.
- Net Cash Flow: The difference between total cash inflows and cash outflows. Formula: Net Cash Flow = (Cash flow Incoming) – (Cash flow Outgoing)
- Other:
- Liabilities: The total amount of liabilities associated with the project. Formula: Customer and vendor, as well as all types of Equity categories. Include all Chart of accounts in the Liabilities category. Credit (Cr) is treated as positive, while Debit (Dr) is treated as negative.
- Assets: The total value of assets associated with the project. Formula: Include all Chart of accounts in the Assets category, except subcategories marked with the Cash Flow checkbox. Debit (Dr) is treated as positive, while Credit (Cr) is treated as negative.
- Other (Assets – Liabilities): The difference between the project’s assets and liabilities. Formula: Other (Assets – Liabilities) = Assets – Liabilities
- Indexes and Indicators
- CPI (Cost Performance Index): An index that measures the project’s cost efficiency based on the value achieved relative to the cost incurred. Formula: CPI = IF(Expense=0, 1, Est. Expense/Expense)
- TCPI (To-Complete Performance Index): An index that indicates the required future cost efficiency to achieve the remaining project target. Formula: TCPI = (Est. Expense – Expense) / (Est. Expense * (100 – Completed % ) / 100)
- ROI (Return on Investment): An indicator that measures the return generated from the investment in the project. Formula: ROI = Profit / Expense * 100%
- Cash ROI: An indicator that measures the return on investment based on the project’s actual cash flows. Formula: Cash ROI = Net Cash Flow / Cash flow Outgoing * 100%
- CVR (Cost Variance Ratio): An indicator that measures the cost variance relative to the planned or estimated project costs. Formula: CVR = Expense / Est.Expense
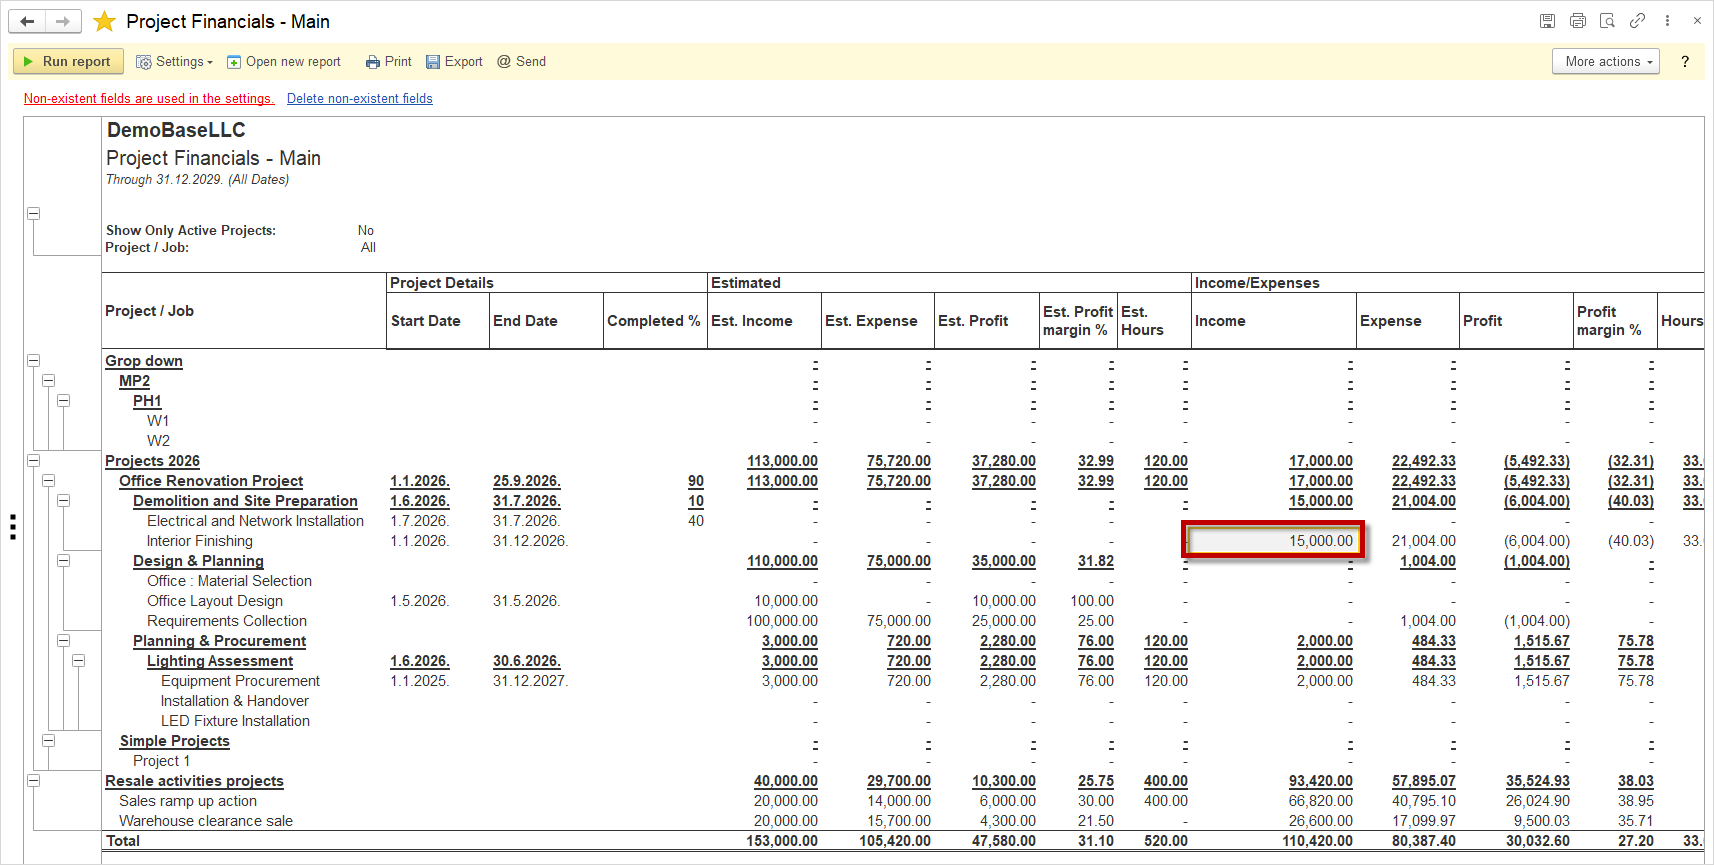
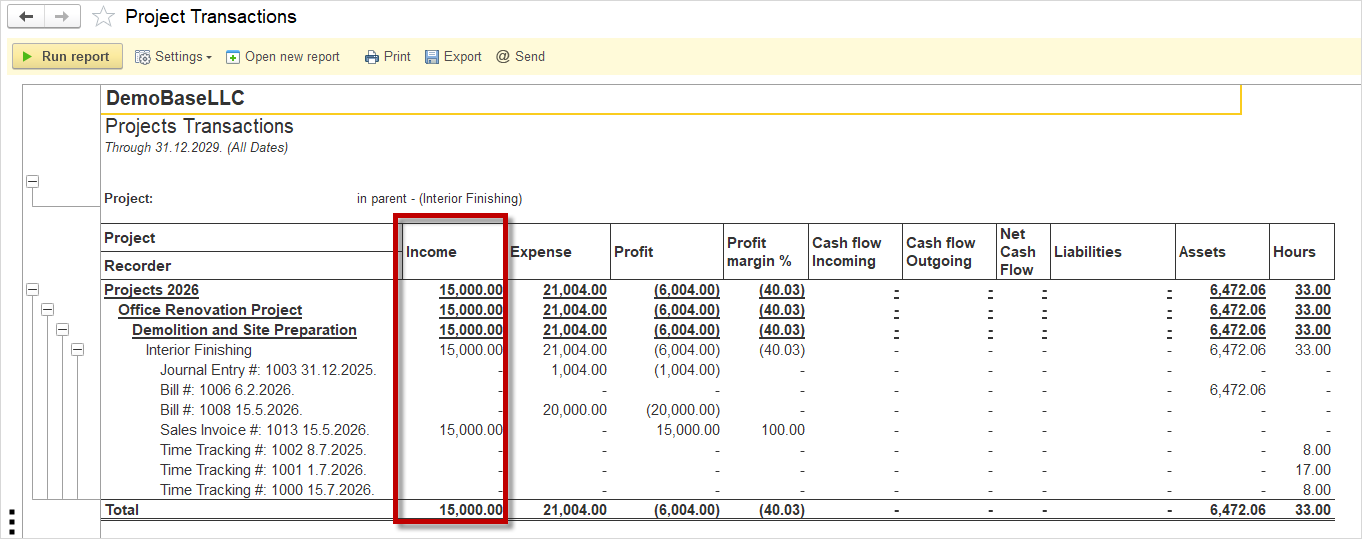
The Project Financial report displays data according to the project hierarchy (Master Project → Phase → Job), at the project level, showing project details, estimates, income, expenses, differences, cash flows, other items, and indicators. In contrast, the Project Transactions report enables the breakdown of this data down to the level of individual documents. This allows the user to start from the summarized data in the Project Financial report and drill down to verify each individual document that contributed to the displayed values, thereby ensuring full transparency and traceability.
When a Project Financial document is created, double-clicking on any field in the report opens the Project Transactions report, providing immediate access to the detailed records behind the displayed values.
Interpretation of Project Financial Indicators #
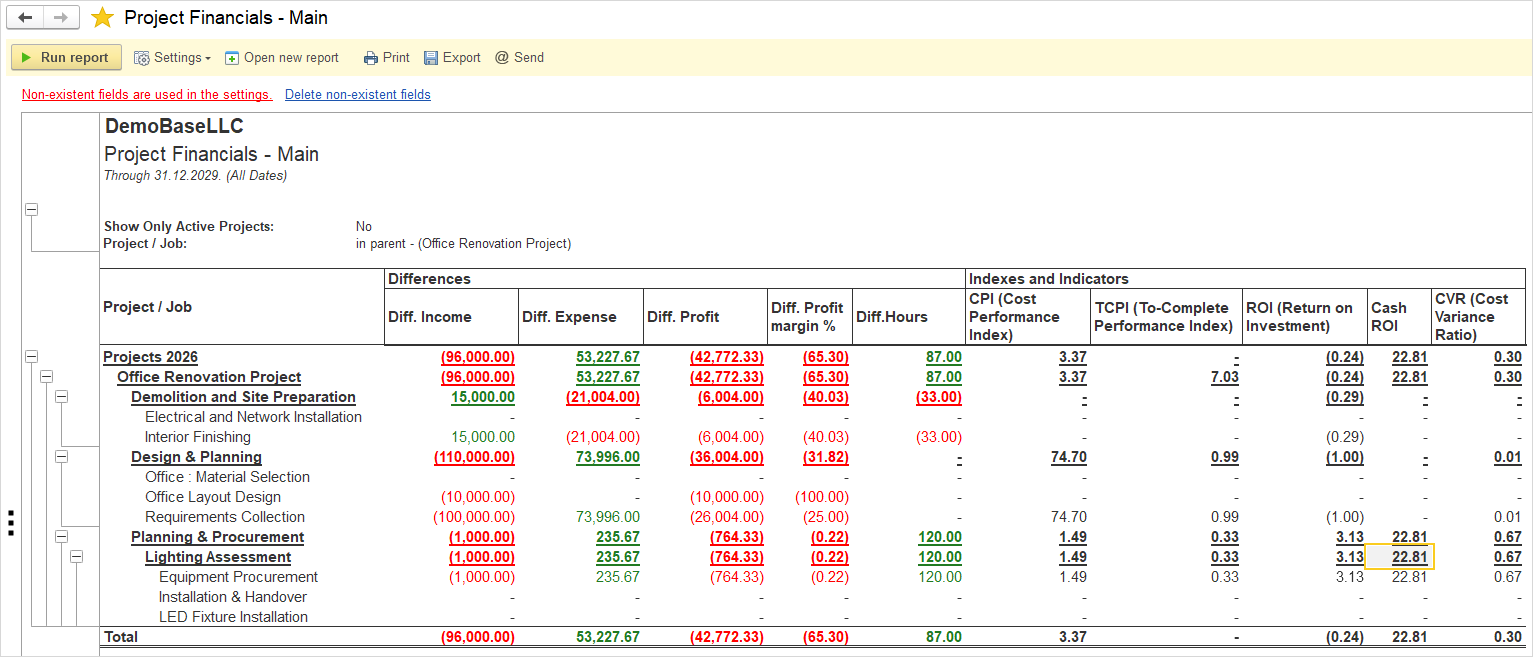
The Project Financials report includes the Differences and Indexes and Indicators sections, which provide additional insight into the Project’s Financial and operational performance.
- The Differences section compares actual project results with their estimated values, helping users identify deviations in Income, Expenses, Profit, Profit margin, and working Hours.
- The Indexes and Indicators section provides additional performance measures used to assess cost efficiency, required performance for the remaining project work, return on investment, cash-based return, and cost variance.
The following tables explain how these values should be interpreted and what their results indicate for the project.
Values in the Differences section are additionally color-coded to make deviations easier to identify: positive values are displayed in green, while negative values are displayed in red.
| Indicator | Interpetation |
| Diff. Income | Indicates whether the project generates more or less income than originally estimated. |
| Diff. Expense | Indicates whether the project incurs more or less expenses than originally estimated. |
| Diff. Profit | Indicates whether the project’s financial result exceeds or falls below the expected result. |
| Diff. Profit Margin % | Indicates whether the project achieves higher or lower profitability compared to the initial estimate. |
| Diff. Hours | Indicates whether more or fewer working hours are required to complete the project than originally planned. |
CPI (Cost Performance Index) measures the relationship between the value achieved and the costs incurred to complete the project.
| Value | Interpetation | Project impact |
| > 1 | CPI is above the reference value of 1 | The project generates more value relative to the costs incurred, indicating more efficient use of project costs. |
| = 1 | CPI equals the reference value of 1. | The value generated by the project corresponds to the costs incurred, indicating the reference level of cost efficiency. |
| 0 – < 1 | CPI is below the reference value of 1. | The project generates less value relative to the costs incurred, indicating lower cost efficiency. |
| = 0 | CPI equals zero. | Based on the available data, the project has no achieved value relative to the recorded costs. |
TCPI (To-Complete Performance Index) indicates the level of cost efficiency required for the remaining part of the project to achieve the defined target.
TCPI (To-Complete Performance Index) = (Est. Expense – Expense) / (Est. Expense * (100 – Completed % ) / 100)
| Value | Project Impact |
| > 1 | The remaining part of the project requires higher cost efficiency to achieve the defined target. |
| = 1 | The remaining part of the project needs to maintain the reference level of cost efficiency to achieve the defined target. |
| < 1 | The remaining part of the project requires lower cost efficiency to achieve the defined target. |
ROI and Cash ROI measure the return generated by the project, using different calculation bases.
ROI (Return on Investment) = Profit / Expense * 100% and Cash ROI = Net Cash Flow / Cash flow Outgoing * 100%
| Value | Interpetation | Project Impact |
| Positive (+) | The project generates a positive return. | The investment associated with the project generates a positive return based on the calculation basis used |
| Zero (0) | The return is equal to zero. | Based on the calculation basis used, the project generates neither a positive nor a negative return. |
| Negative (-) | The project generates a negative return. | The project result is below the investment basis used for the calculation. |
ROI measures the return relative to the investment basis defined by the indicator’s formula, while Cash ROI measures the return based on the project’s cash flows.
CVR (Cost Variance Ratio) indicates the cost variance relative to the relevant planned or estimated basis. CVR (Cost Variance Ratio) = Expense / Est.Expense
| Value | Interpetation | Project Impact |
| Positive (+) | CVR has a positive value. | The project has a positive cost variance based on the calculation basis used. |
| Zero (0) | There is no cost variance based on the calculation basis. | Actual costs correspond to the relevant basis used for the calculation. |
| Negative (-) | CVR has a negative value. | The project has a negative cost variance based on the calculation basis used. |