
The Sales by Customer report offers comprehensive analytical capabilities to support business performance evaluation and strategic decision-making. Below are the primary use cases for this report:
- Product Performance
Item-Level Analysis: Each item sold is listed with its description. Users can determine which items are most popular or profitable. Sales Price and Quantity: The report provides the sales price and quantity sold for each item, enabling users to evaluate pricing strategies and demand. - Analyze Sales Performance
Revenue and Gross Profit: The report shows the revenue, cost of sales, and gross profit for each transaction. This allows users to identify high-performing items or customers contributing the most to profitability. Gross Margin: The gross margin percentage helps evaluate which products or customers yield the highest profitability. - Customer Insights
Customer-Specific Data: The report categorizes sales by customer (e.g., “Bags World LLC,” “First UAE Distributor”). Users can assess which customers generate the most revenue or profit. Customer Trends: By reviewing transaction dates and quantities, users can identify purchasing patterns or seasonal trends for specific customers. - Salesperson Evaluation
The “Sales Person” column identifies who handled each transaction (e.g., “Rituraj Borkakoty”). This can help assess individual performance and contribution to overall sales. - Inventory Management
Stock Adjustments: The inventory adjustment entry (e.g., for “Leather jacket”) provides insights into stock changes that may not be tied to direct sales. Quantity Sold: Reviewing quantities sold per item helps in planning inventory levels and avoiding overstocking or stockouts. - Reporting and Decision Making
This report can be used to prepare presentations for stakeholders, develop marketing strategies for high-performing products, or negotiate better terms with key customers
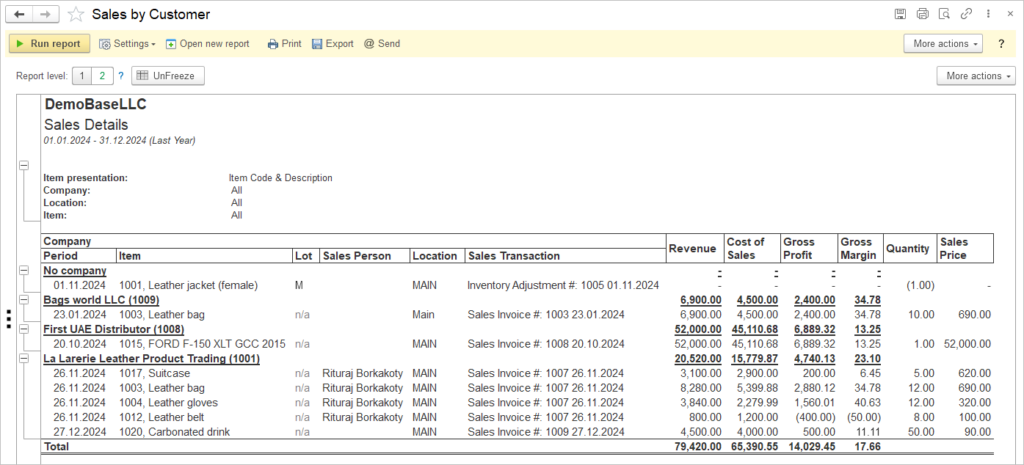
Navigate to Reports →Sales → Sales by Customer.
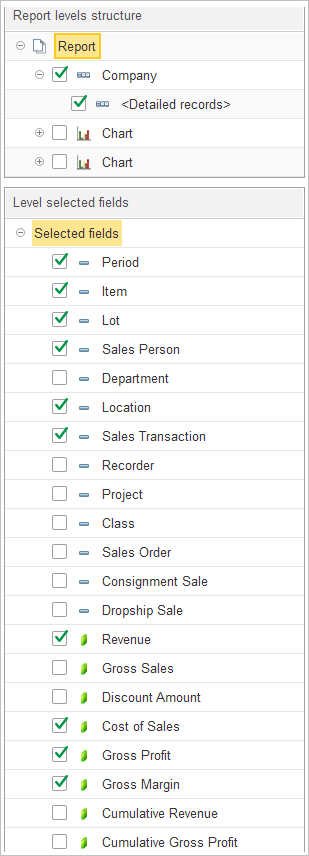
The Report levels structure determines the hierarchical organization of data within the report.
- Company: Groups sales data by the company entity.
- Detailed records: When enabled, this level provides a granular view of individual transactions within the company structure.
- Chart: Allows users to include visual representations (charts) of the sales data in the report.
Users can expand the Structure section to include or exclude these levels using checkboxes or rearrange the hierarchy via drag-and-drop functionality.
The Level selected fields section allows for the selection of specific data points to be displayed as columns in the report output. The following fields are available for configuration:
- Dimensions and Attributes:
- Period: Displays the time frame of the sales transaction.
- Item: Identifies the product sold.
- Lot: Displays the lot number for the items sold.
- Sales Person: Identifies the employee responsible for the transaction.
- Department: Shows the department associated with the sale.
- Location: Specifies the inventory or sales location.
- Sales Transaction: Provides details regarding the specific transaction.
- Recorder: The name of the document confirming financial transaction
- Class: An additional classification related to the sale’s category.
- Project: Association with any specific project, if applicable.
- Sales Order: Displays the associated sales order number.
- Consignment Sale: Indicates if the transaction is a consignment sale.
- Dropship Sale: Indicates if the transaction is a dropship sale.
- Financial Metrics:
- Revenue: Displays the total revenue generated.
- Gross Sales: Shows the total gross sales amount.
- Discount Amount: Displays the value of applied discounts.
- Cost of Sales: Shows the direct costs associated with the items sold.
- Gross Profit: Displays the calculated profit after deducting the cost of sales.
- Gross Margin: Shows the gross margin percentage.
- Cumulative Revenue: Displays the running total of revenue.
- Cumulative Gross Profit: Displays the running total of gross profit.
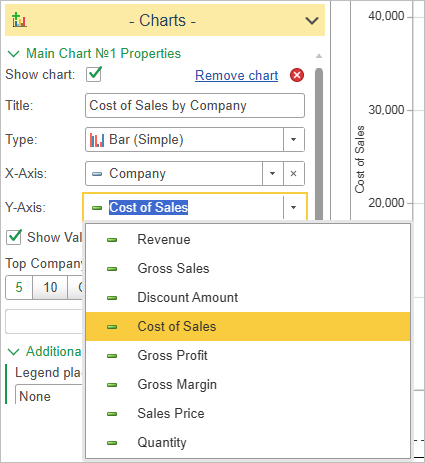
You can add chart to this report to visualize the data by different measures Company/Sales Order/etc. to Gross Margin/Revenue/Cost of Sales/etc.
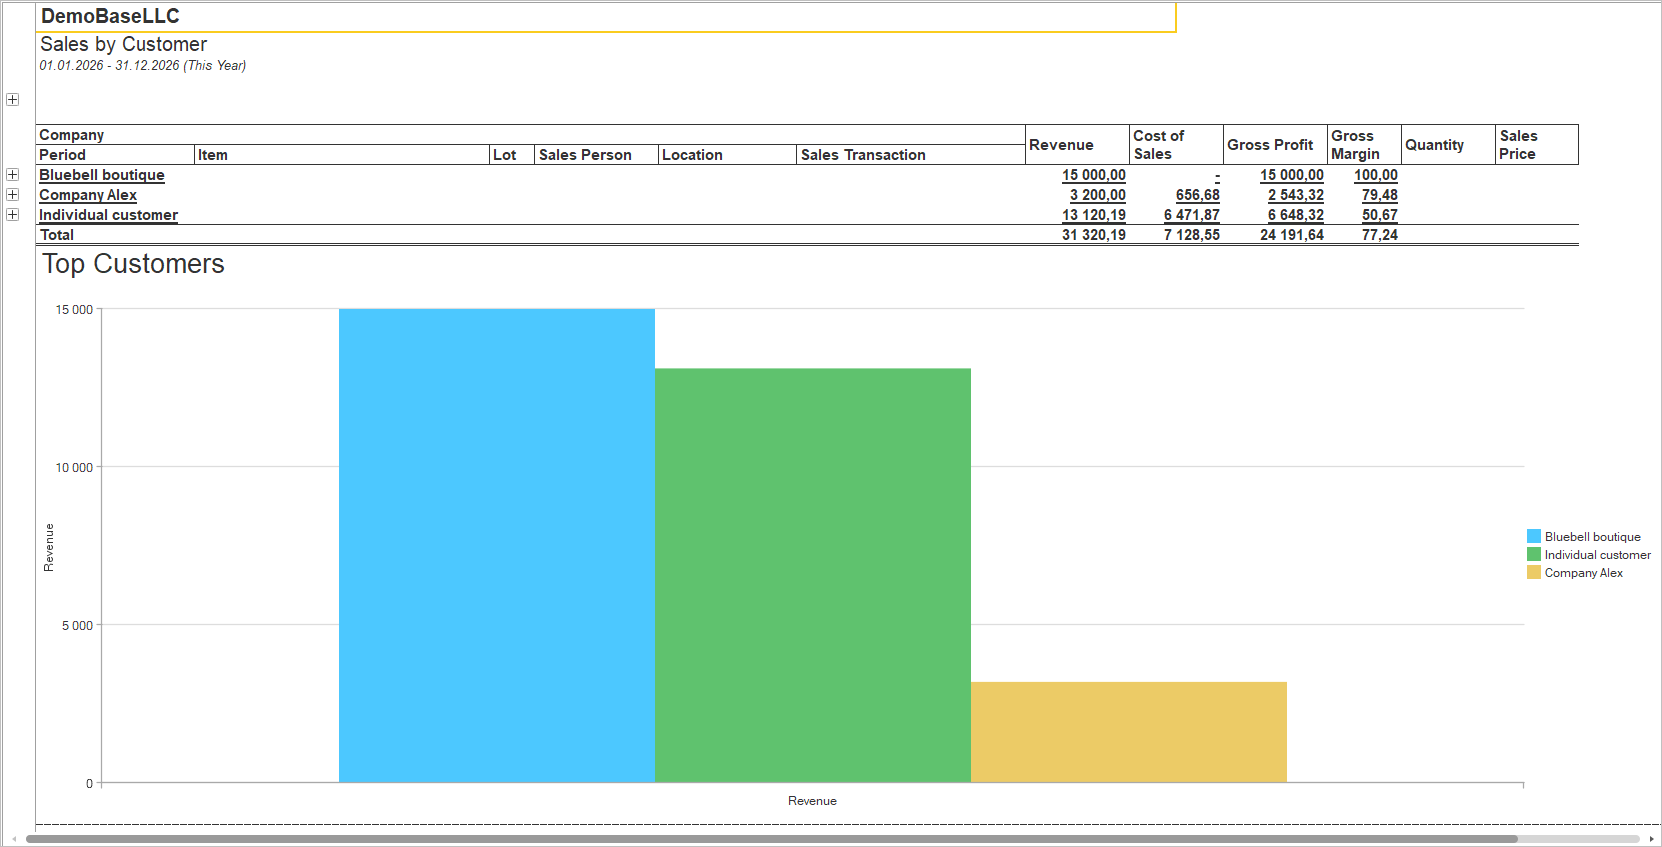
Choose X-Axis and Y-Axis with different measures to have various charts.
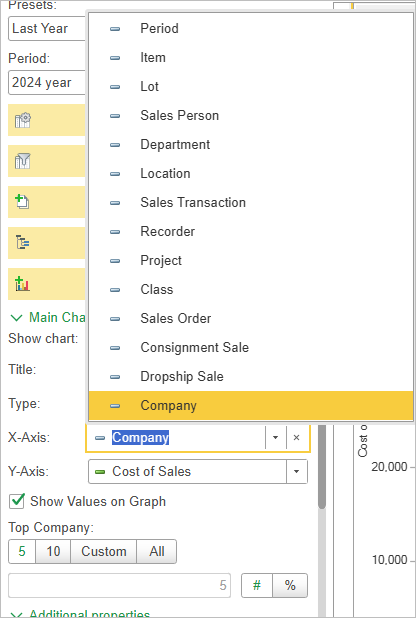
Other sales reports available for performance analysis include Sales by Item, Sales by Location and Sales by Representative.