Analysis of lead base #
This report provides a detailed overview of the dynamics of client base development and its distribution among responsible managers. In the Analysis of lead base report, the analysis is performed based on data from the Leads directory, using visual elements such as pie charts and a line graph to clearly display the total number of Leads, the percentage of new Leads within a selected period, and the overall growth trend.
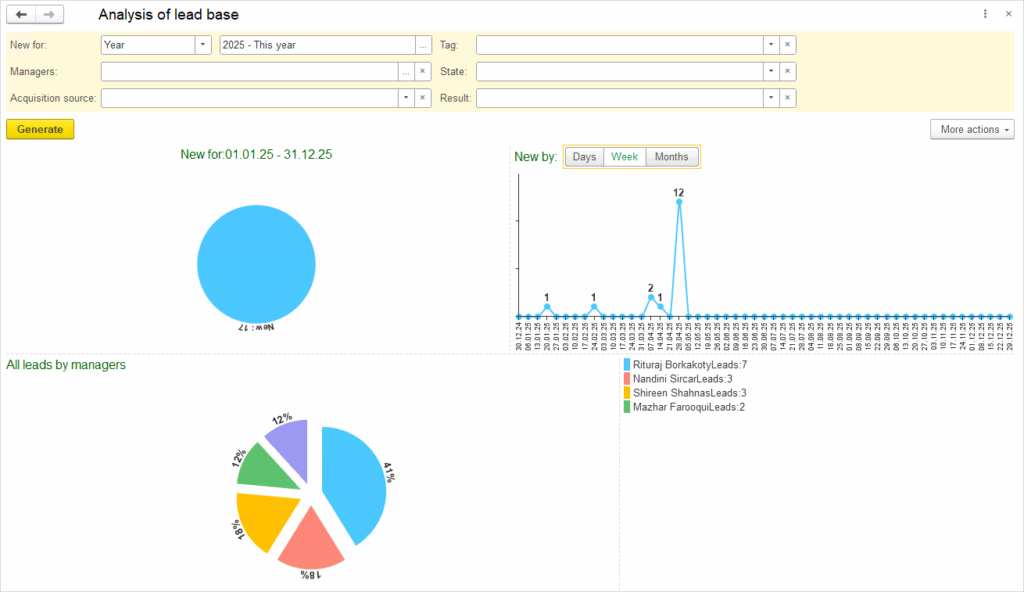
The report allows you to:
- select the time period during which leads will be considered new,
- filter data by Manageres, Acquisition source, Tag, State or Result.
- compare the performance of different Managers based on the number and percentage of new leads.
This type of analysis helps identify active client Acquisition sources, assess team efficiency, and make strategic decisions to improve the sales process.
Sales Funnel #
Sales Funnel is a powerful analytical report that visually displays the quantitative distribution of all deals across various stages of the Sales process. The report covers the entire Sales cycle — from the initial Customer inquiry to the conclusion of the deal, whether it ends in success or rejection.
The report is based on data from the Sales Order and Work Order documents and can be presented in three formats:
- by Leads,
- by Customers,
- by Sales orders,
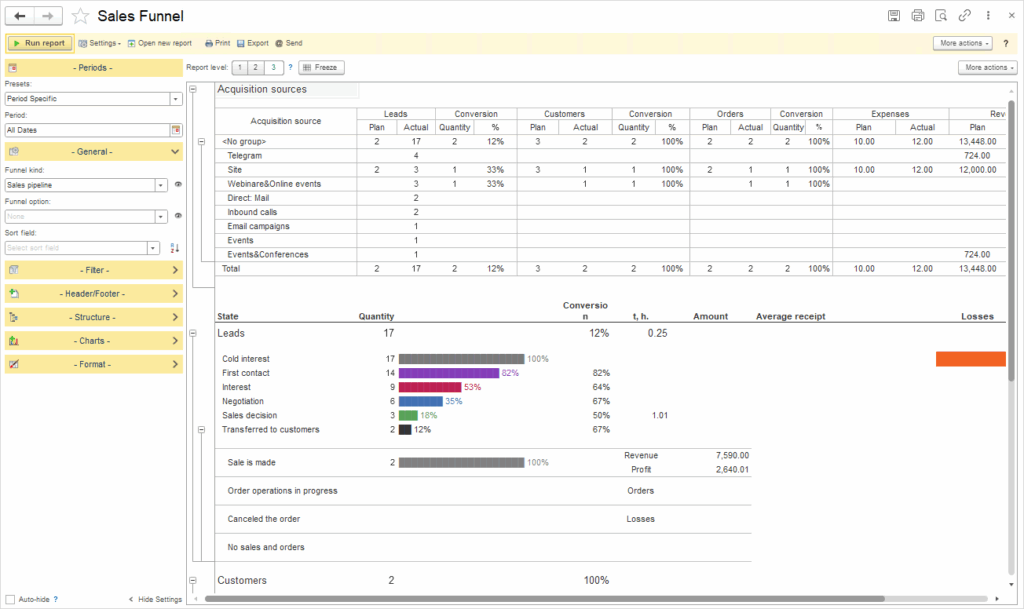
The Combined Sales Funnel option merges all three formats into one consolidated view.
The structure and sequence of stages in the funnel correspond to the statuses in the Sales orders. Each stage is visually represented as a colored bar, the length of which reflects the number and percentage of deals at that stage.
To the right of the main funnel, the Loss Amount is displayed, showing the total monetary value of deals lost at each stage and the reasons behind them. This part of the report is particularly valuable for identifying weak points in the sales process and improving client engagement strategies.
Funnel by Leads #
Funnel by Leads is an analytical report that provides a comprehensive overview of how potential clients move through different stages of the sales process. Instead of displaying individual leads, the report shows aggregated data for all leads within the selected period, enabling a high-level strategic analysis of sales activities.
Filters are available for selecting the Time period, Manager, and Acquisition source (e.g., website, phone, events), allowing for flexible and targeted analysis.
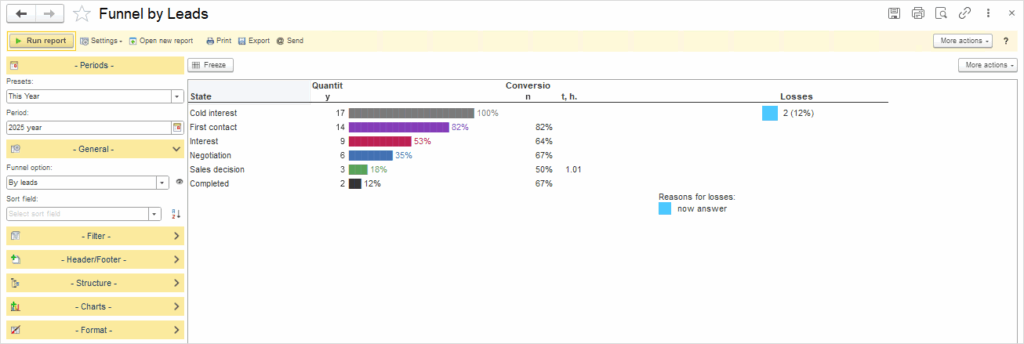
The report table includes the following columns:
- State – the current stage of the Leads (e.g., new, in progress, proposal sent, deal closed).
- Quantity – the number of Leads at each stage, also visually represented as colored bars, reflecting both the count and percentage of Leads per stage.
- Conversion – the percentage of Leads that successfully moved to the next stage.
- Losses – the number of Leads lost at a given stage.
- Reasons for Losses – explanations for why Leads were lost (e.g., not interested, price too high, contact lost, etc.).
This report is particularly useful for sales managers, as it helps identify weak points in the process, understand the reasons behind lost Leads, and improve strategies for engaging with potential customers.
ABC/XYZ analysis of sales by items #
The ABC/XYZ sales analysis by items is a key tool for classifying products based on their sales value and demand stability. By combining these two types of analysis, a company can optimize procurement, manage inventory, and more accurately forecast demand.
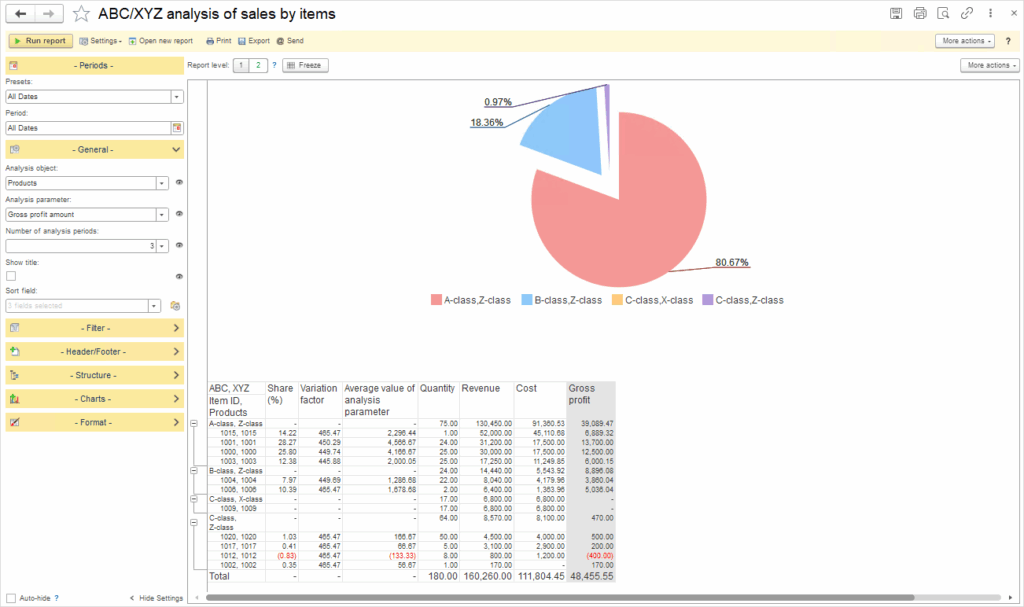
ABC analysis divides products according to their contribution to overall revenue:
- Category A includes high-value products that generate the largest portion of revenue, even though they are relatively few in number. These are the most important products for the business.
- Category B includes medium-value products that moderately contribute to overall revenue.
- Category C contains low-value products that generate less revenue but are available in large quantities.
XYZ analysis assesses the stability of demand using the coefficient of variation, which measures fluctuations in consumption:
- Category X includes products with stable and predictable demand, with small deviations and high forecasting accuracy.
- Category Y includes products with moderate fluctuations, often of a seasonal nature, and average forecasting accuracy.
- Category Z includes products with irregular and difficult-to-predict demand, where consumption is hard to forecast.
The graph shows a combination of the ABC/XYZ analyses, which helps visualize the importance and demand stability of products.
- A-Z – products that generate the highest revenue but have unstable demand. These products require careful inventory management.
- B-Z – products of medium importance with unstable demand. They are not a priority for constant stocking.
- C-Z – low-value products with irregular demand. These products are typically ordered as needed or occasionally removed from the offer.
This analysis aids in making decisions about which products should be prioritized for procurement and which can be optimized or reduced.