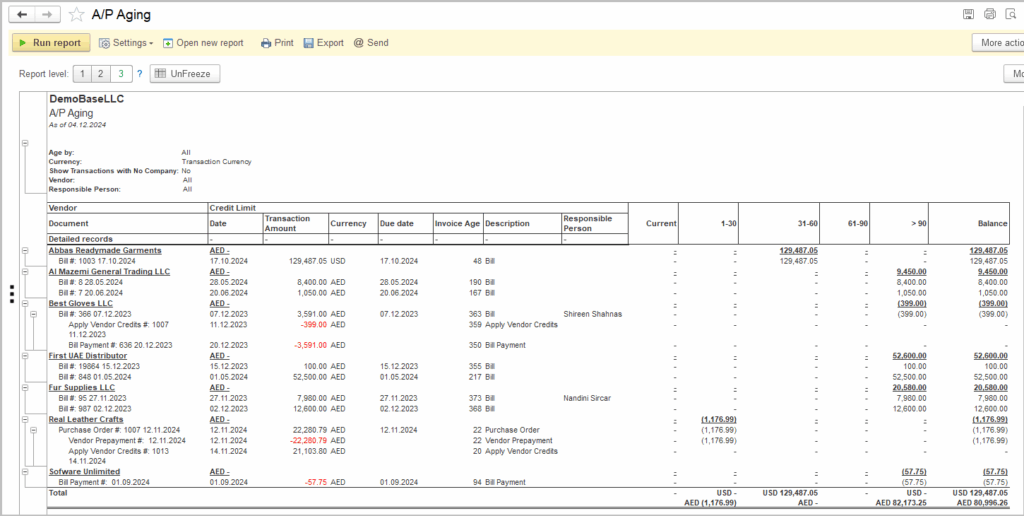
By analyzing the accounts payable aging report, you can gain valuable insights into your company’s payment obligations and better manage your cash flow. Understanding the aging of your payables allows you to prioritize payments, negotiate better terms with suppliers, and avoid late fees or penalties.
Monitoring the accounts payable aging helps you identify any discrepancies or errors in invoicing, ensuring that you only pay for goods and services that have been received and accurately billed. This proactive approach can help prevent overpayments and improve your overall financial accuracy and efficiency.
Analyzing the accounts payable aging report also enables you to assess your relationships with suppliers and vendors. By tracking the aging of payables by vendor, you can identify any overdue payments, address any issues promptly, and maintain positive relationships with key suppliers to ensure a steady supply of goods and services.
Navigate to: Reports → Purchases → A/P Aging
Available settings:
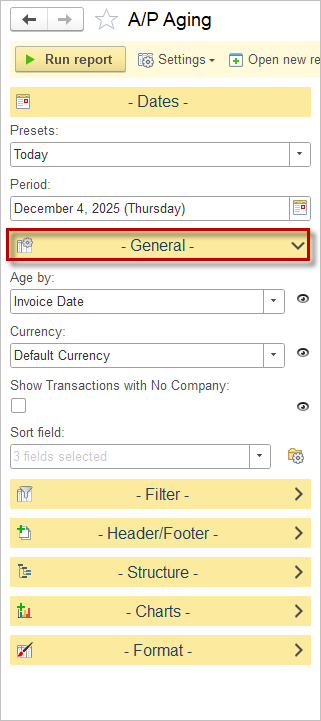
he General section of the AP Aging report controls how amounts are aged, which currency is used, whether to show transactions without a company, and how to sort the output.
Age by
- A dropdown that lets you choose the basis for aging (for example, Invoice Date, Due Date, etc.).
- The selected option “Invoice Date” means the report will place transactions into aging buckets based on the original invoice date.
Currency
- A dropdown that defines which currency the report uses.
- “Transaction Currency” means the report will show amounts in the original currency of each transaction rather than converting them to a single base or reporting currency.
Show Transactions with No Company
A checkbox that, when enabled, includes entries that are not linked to a vendor/company record.
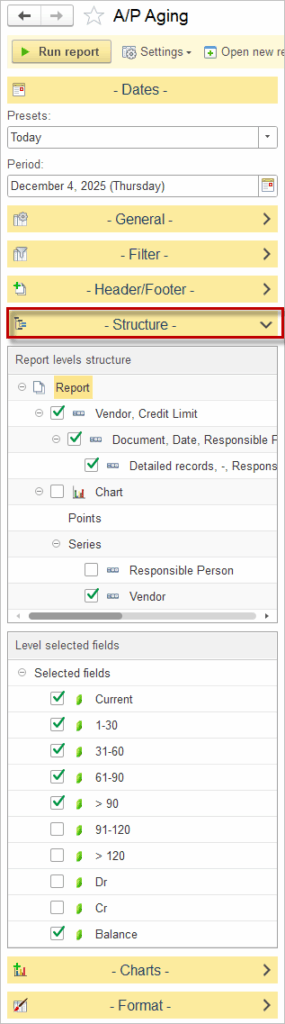
In Report levels structure, select how data is grouped in the report.
- At the top, grouping options such as Vendor, Credit Limit and Document, Date, Responsible Person are available. This means the report will first show totals by Vendor (including credit limit information) and then break them down by individual documents and dates for more detail.
- Additional nodes such as Chart, Responsible Person, and Vendor under series allow you to prepare the structure for graphical analysis; when the checkbox next to a level is enabled, the report (and charts, if used) will summarize data by that level.
To adjust the structure as a user, expand the Structure section, then tick or clear checkboxes next to each level to add or remove it from the report hierarchy. Dragging levels lets you change the order in which groupings appear.
In Level selected fields, choose which numeric columns (aging buckets and balances) appear for the selected level.
- Fields available: Current, 1–30, 31–60, 61–90, > 90, and Balance, so the report will display separate columns for each of these buckets plus a total balance column. This matches common AP aging practice, where open invoices are allocated into time bands measured in days overdue.
- Optional buckets such as 91–120, > 120, Dr, and Cr are also available. Enabling them would add additional columns for more granular long‑overdue amounts or separate debit/credit breakdowns.