AccountingSuite’s Income Statement Report is designed with accounting standards in mind. The report shows how income and expenses are incurred (both operating and non-operating) over a given time period. Navigate to Accounting – Reports – Income Statement.
In addition to standard settings available in all reports, there are specific settings available:
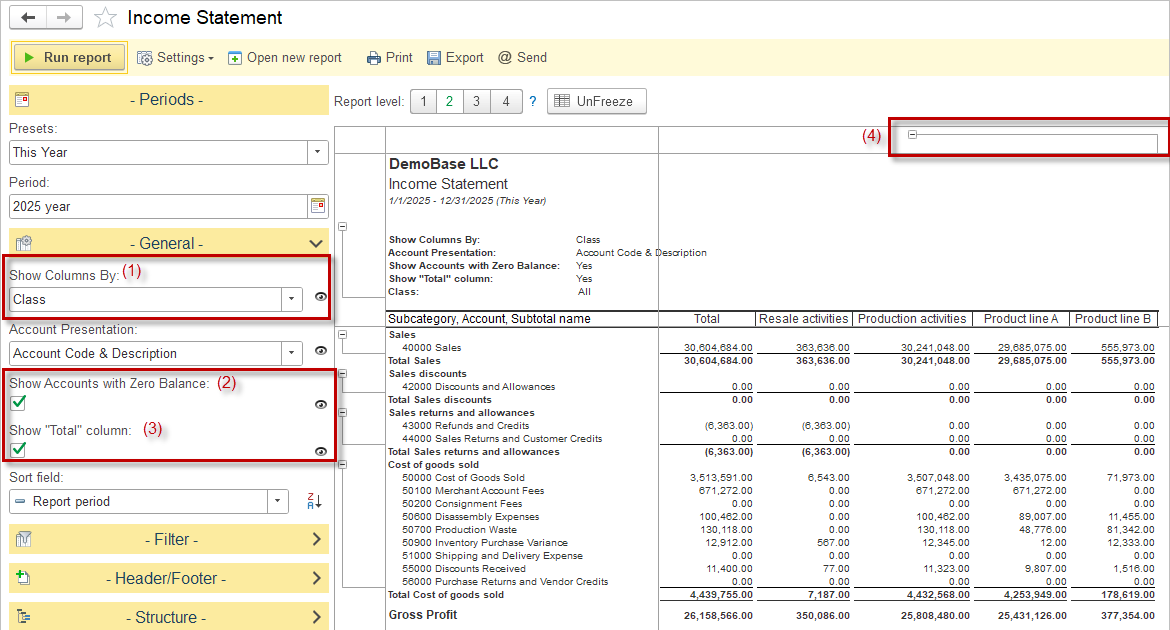
- Show Columns By (1) provides breakdown by: Day, Week, Month, Quarter, Year, Class or Project.
- Users can opt to show accounts even if their balances are zero (2) and include a “Total” column to summarize amounts (3).
- Expandable Class Columns (4): When using classes with hierarchical relationships, users can expand or collapse sections to view detailed or summarized data, improving navigation through complex datasets.
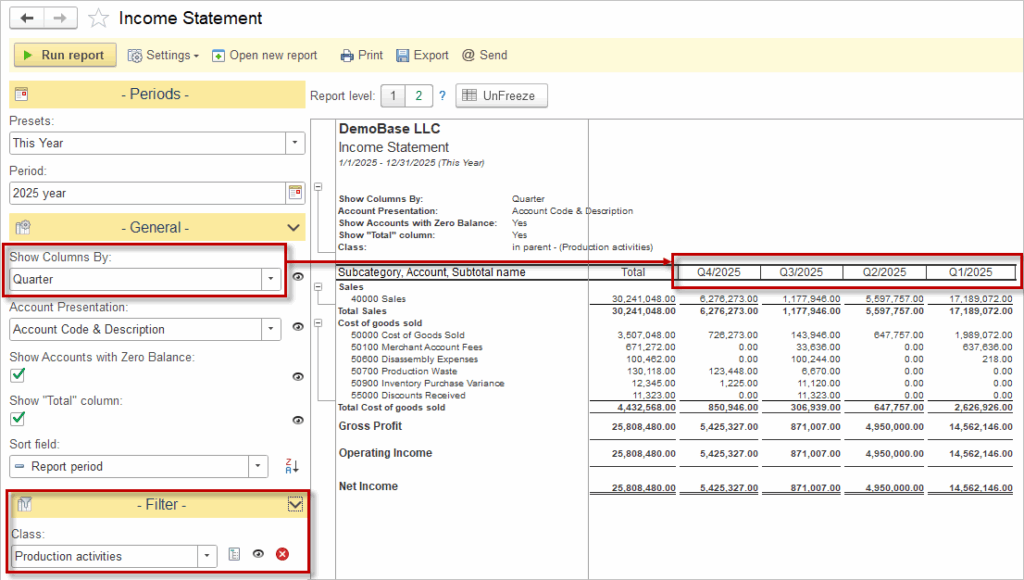
The “Show Columns By” option can be used in combination with the filtering feature—for example, a user can apply a filter by Class while choosing to display columns by Quarters, providing a flexible and powerful way to customize the report view.
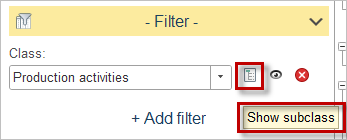
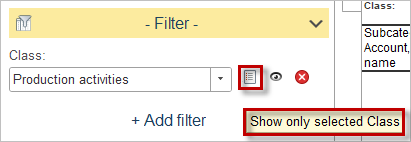
Please note the icon next to the filter—it allows you to toggle between displaying all subclasses or showing only the selected Class.
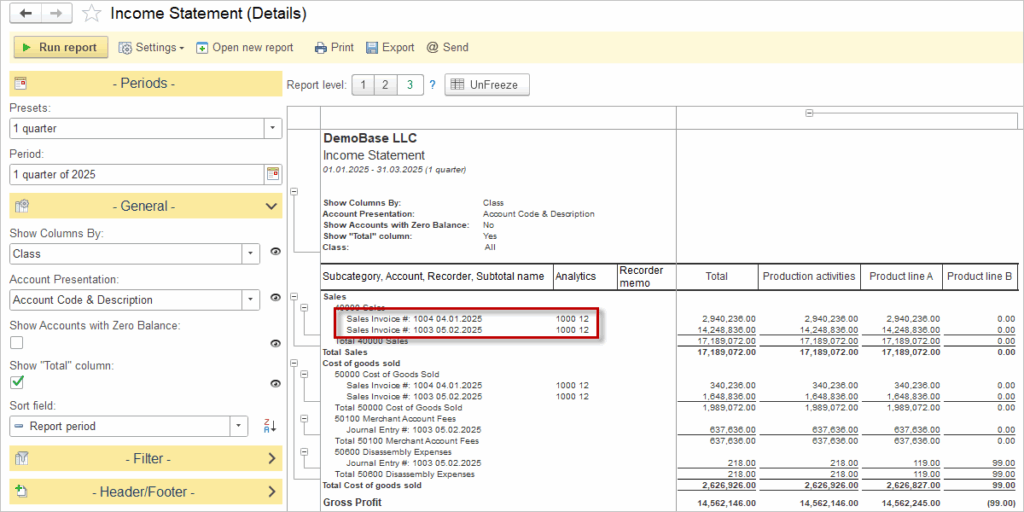
Income Statement (Details) #
The Income Statement (Details) report provides a comprehensive, document-level breakdown of all income and expenses for a selected period.
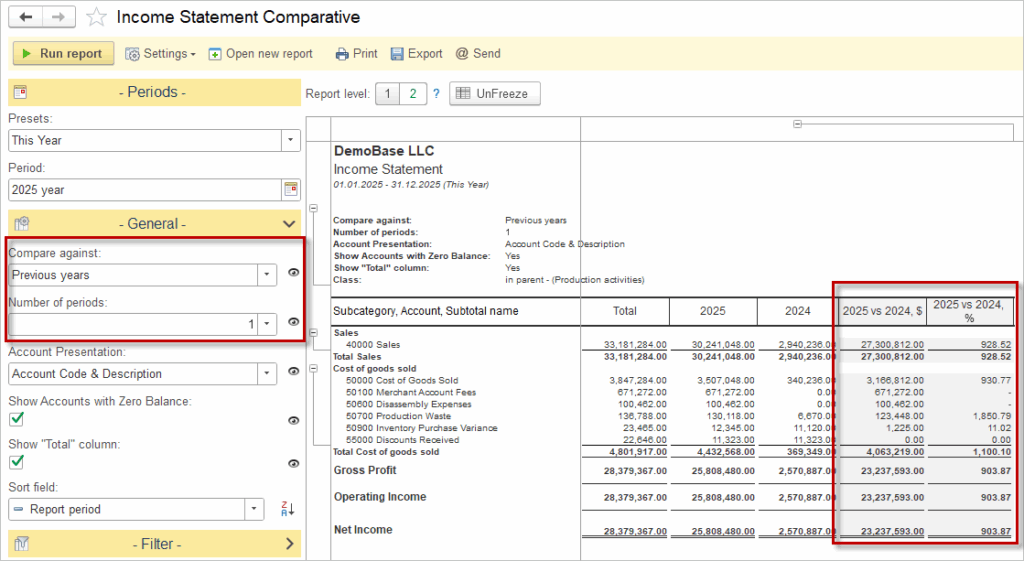
Income Statement Comparative #
The Income Statement Comparative report presents financial results side-by-side for multiple periods or entities, enabling easy comparison of revenues, expenses, and profitability trends over time. Filtering options by Class or Project can be applied here as well, allowing for detailed analysis and comparison across different segments or initiatives.