Overview #
Our software has more than 20 different report forms that will help you in most cases, but you may face a situation unique to your business, and there universal report tool comes in handy. With that tool, you can create a report form of your own purely for your tasks.
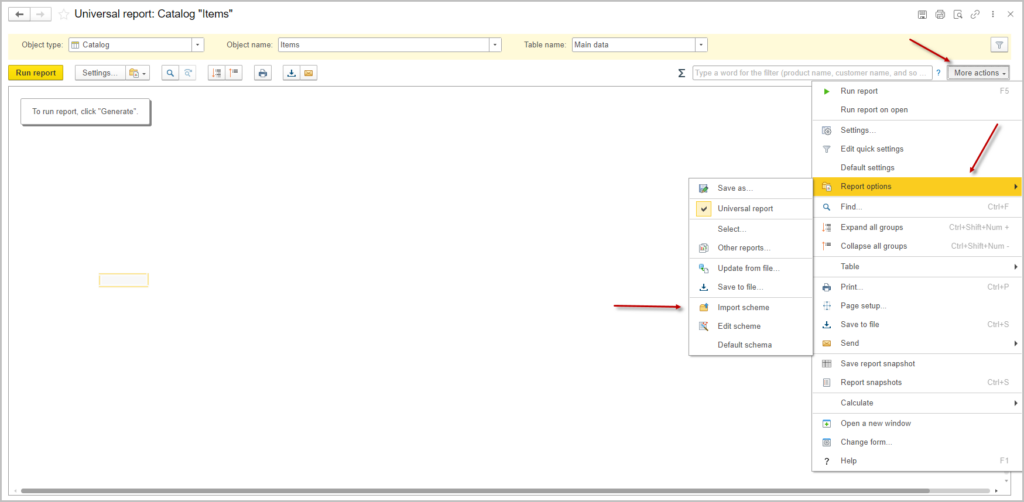
Navigate to Reports → Tools → Universal Report
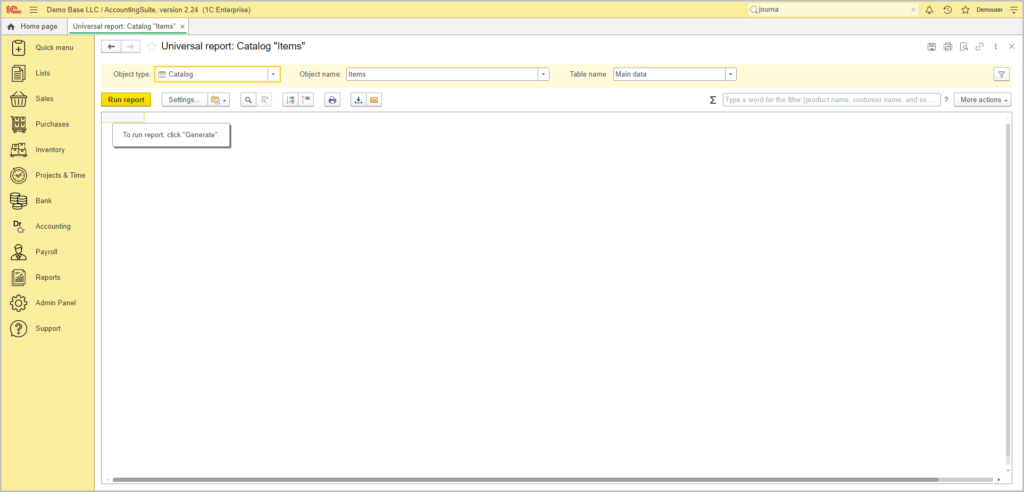
The universal report involves modifying the report structure, setting necessary parameters, creating custom fields, and setting grouping, selection, and sorting fields for each report element.
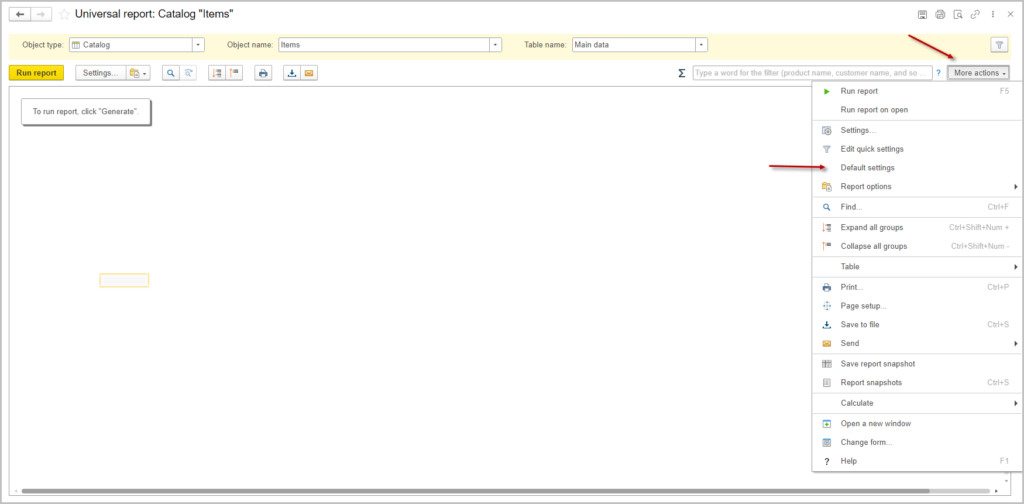
At any time, the modified report configuration can be reset to its original state More actions →Default settings.
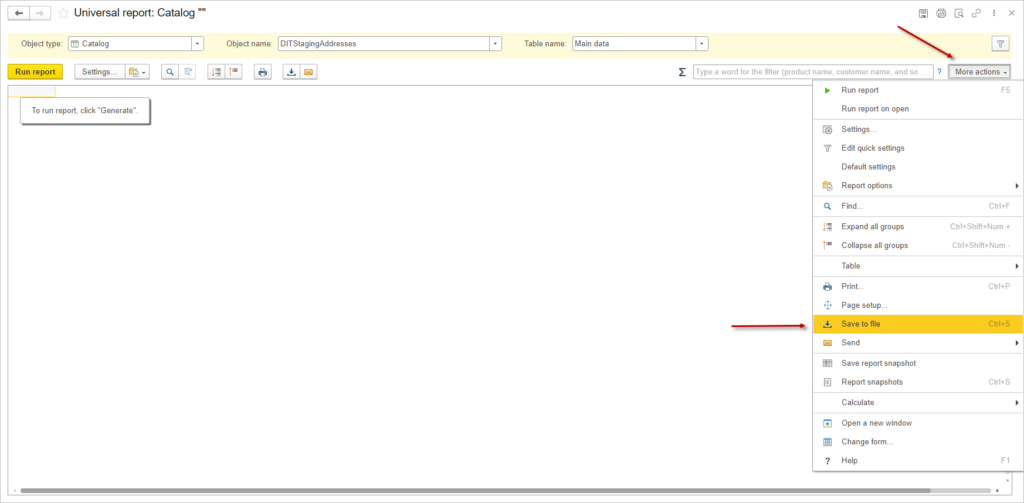
More actions → Save to file allows saving the report settings to a file. Or you can use Ctrl+S shortcut
Settings from a file can be loaded and used More actions → Report options → Import scheme.
Settings #
Filters #
On the Filters tab, you can change the main parameters of the report: object type, object name, table name. This is the main data that will be used to construct your report
On the Filters tab, select fields to filter the report result records. Fields can be added using the ![]() Add button. After you have added a field, you can choose the condition and value for sorting.
Add button. After you have added a field, you can choose the condition and value for sorting.
Select a Condition by double-clicking with the left mouse button.
Enter the parameter Value by double-clicking the left mouse button.
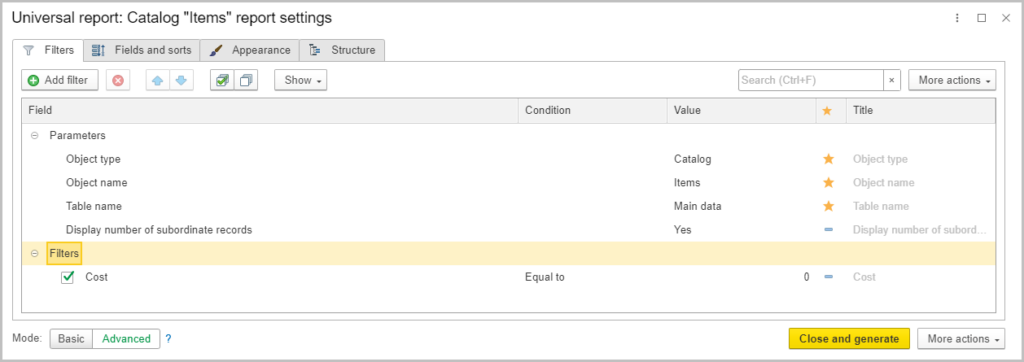
The program supports the following comparison types:
- Equal to: Records where the field value matches the specified value.
- Not equal to: Records where the field value does not match the specified value.
- Less than Records where the field value is less than the specified value.
- Less than or equal to: Records where the field value is less than or equal to the specified value.
- Greater than: Records where the field value is greater than the specified value.
- Greater than or equal to: Records where the field value is greater than or equal to the specified value.
- In list: Records with fields matching any value in the list. The value list is set in a separate window.
- Not in the list: Records with fields not matching any value in the list. The value list is set in a separate window.
- Filled: Records where the specified field is filled
- Empty: Records where the specified field is not filled.
Fields and sorts #
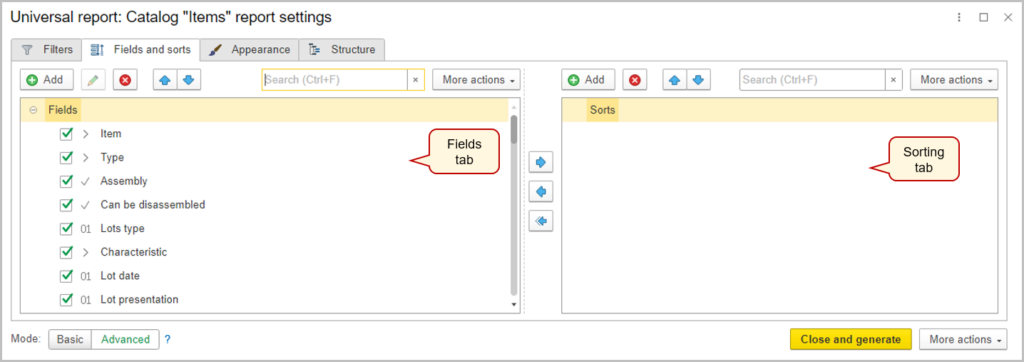
On the Fields and sorts tab, select the fields to be displayed in the report. Check or uncheck boxes of needed fields. If no fields are selected, the report will display an empty element. New fields can be added by using the ![]() Add button. On the Sorting tab, add fields to sort the report result. Change the direction of sorting if necessary. If there are several sorts, then, if necessary, you can raise or lower the sorting priority using the
Add button. On the Sorting tab, add fields to sort the report result. Change the direction of sorting if necessary. If there are several sorts, then, if necessary, you can raise or lower the sorting priority using the ![]() and
and ![]() buttons.
buttons.
Adding formula #
On the fields and sorts tab you have an opportunity to work with formulas. Using the Add Formula button, you can open the formula constructor – the Edit formula window.
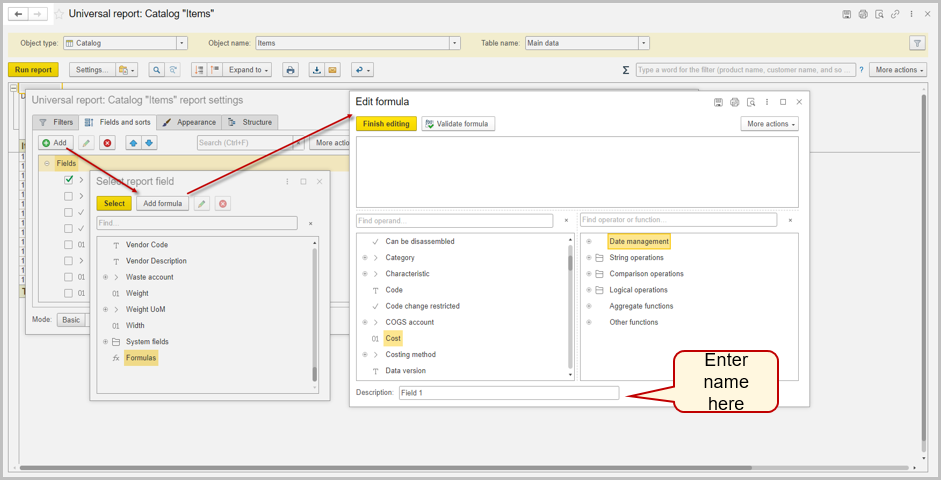
When you click the Finish editing button, a new item appears in the Formulas group in the selection window. It is impossible to replace the existing fields with a formula. You can add various fields from the list of operators and functions to the formula. You can add the name of the formula at the bottom of the window. After completing the formula, click Finish Editing, select a new formula and click Select.
Appearance #
On the Appearance tab, you can set the formatting for various report elements. Also, you can highlight elements based on the data values displayed in the report. For instance, you can point out negative values in color, etc.
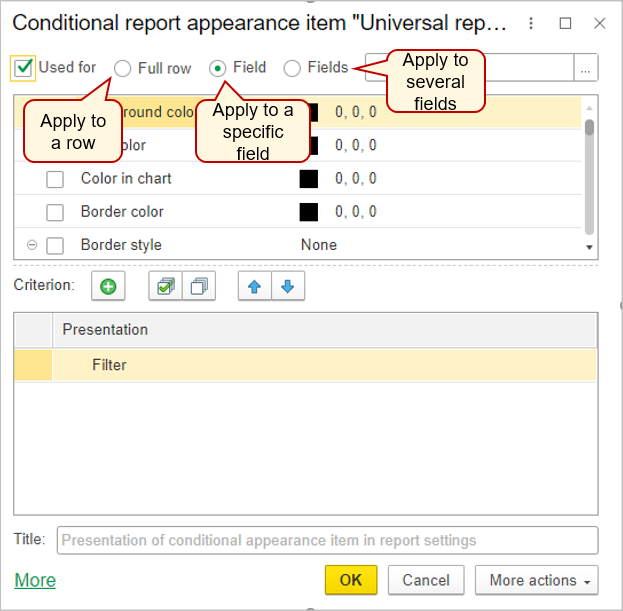
Click ![]() Add to add formating to the element. You can use the switch to select which elements the conditional design applies to:
Add to add formating to the element. You can use the switch to select which elements the conditional design applies to:
- The entire line;
- Field – select a field from the list;
- Fields – Select several fields from the list using the
 Add button.
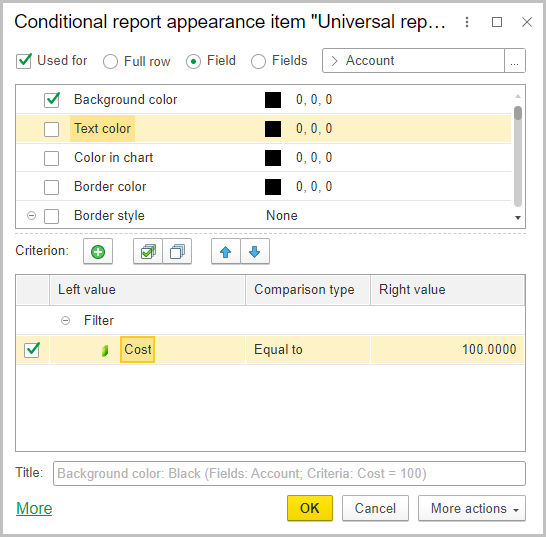
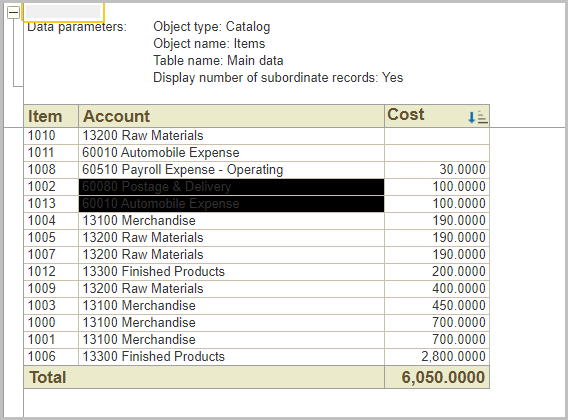
Add a criterion to highlight specific entries. The selection is configured in the same way as on the Filters tab. In the following example all entries of Account field, where cost is equal to a hundred will have background color black.
Result:
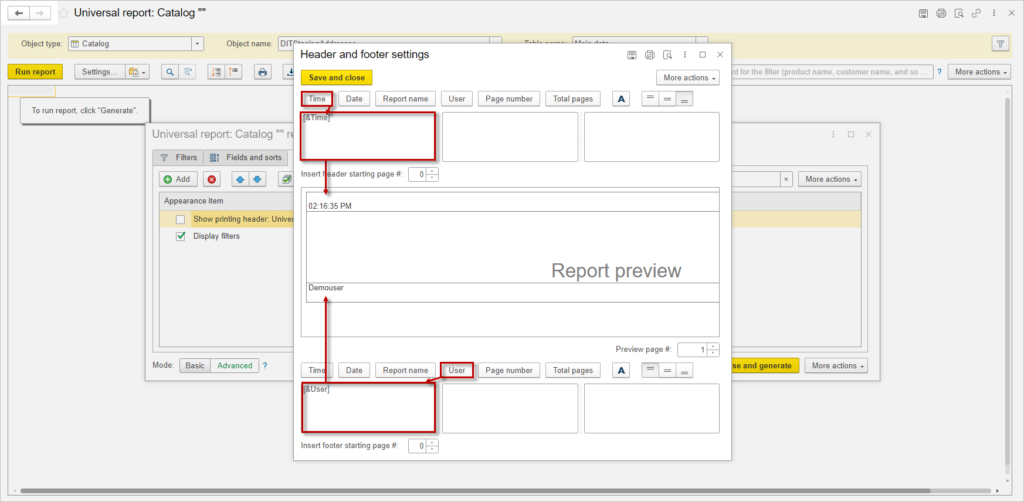
You can set up individual Headers and Footers for this version of the report using the navigation bar button.
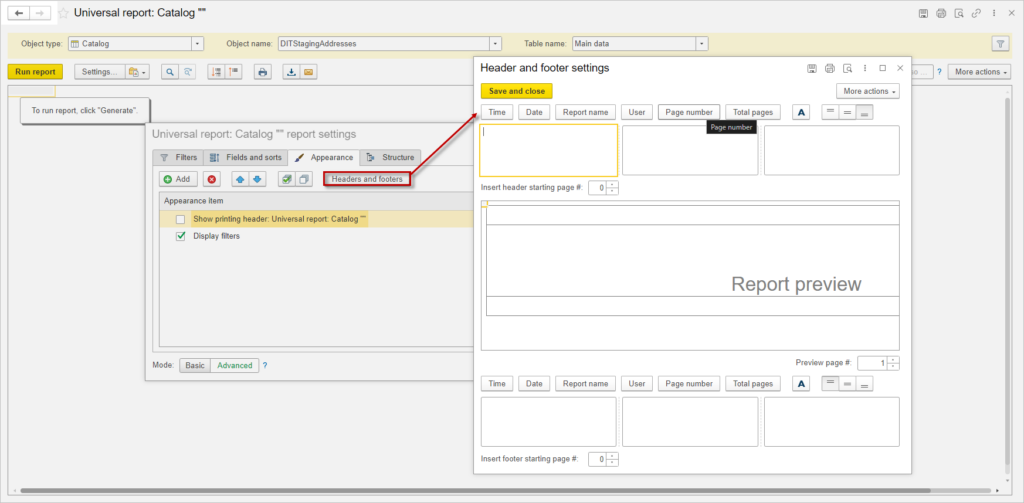
Use the navigation bar buttons to position the headers and footers in the desired location (left, right, or center) at the top or bottom of the report. To do this, select the cell you want, for example the top left corner, and click the appropriate navigation bar button. The header or footer designation will appear in the selected cell. For example, [&Time] will display in the selected cell if you choose the Time button. In the middle of the window, you will see a report preview with the headers and footers so you can see the results of your configuration immediately. Once you’re finished setting up the headers and footers, click Save to save your changes.
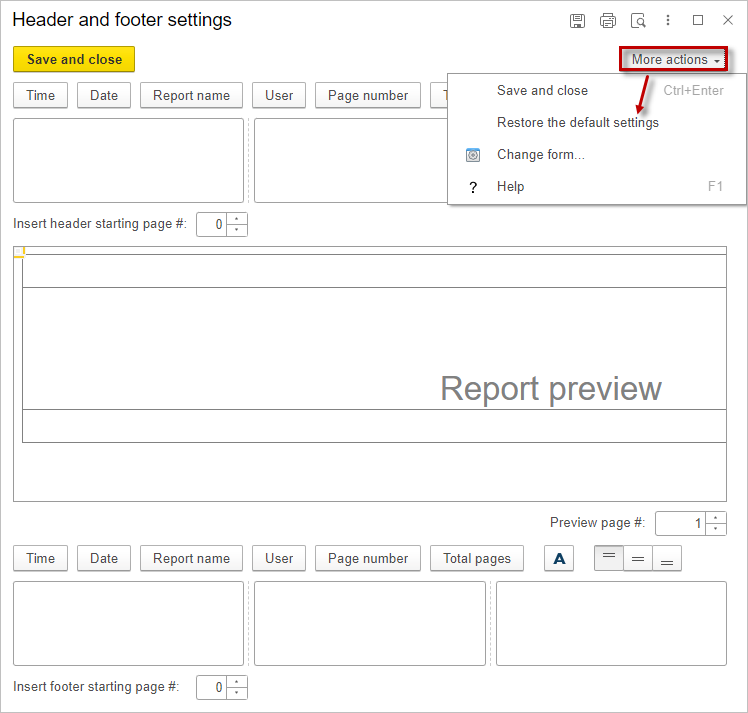
If you are not satisfied with them, you can cancel them by using the Restore the default settings.
Structure #
Report elements can include grouping, table, and chart.
Grouping #
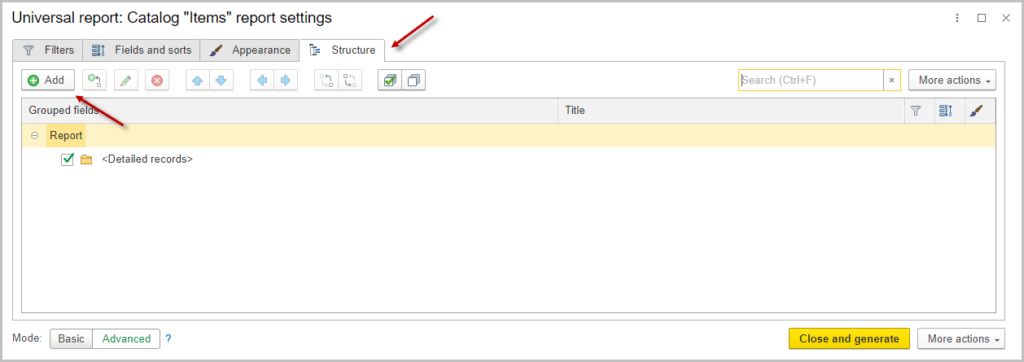
Grouping displays data as a list. To add a grouping to the report, use the ![]() Add button. In the pop-up window select the field.
Add button. In the pop-up window select the field.
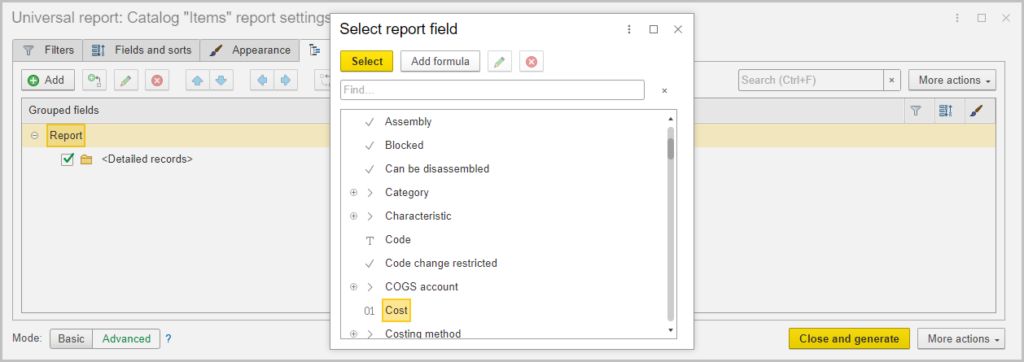
After that double click on the name of the field to enter grouping settings. There you can change the type of grouping.
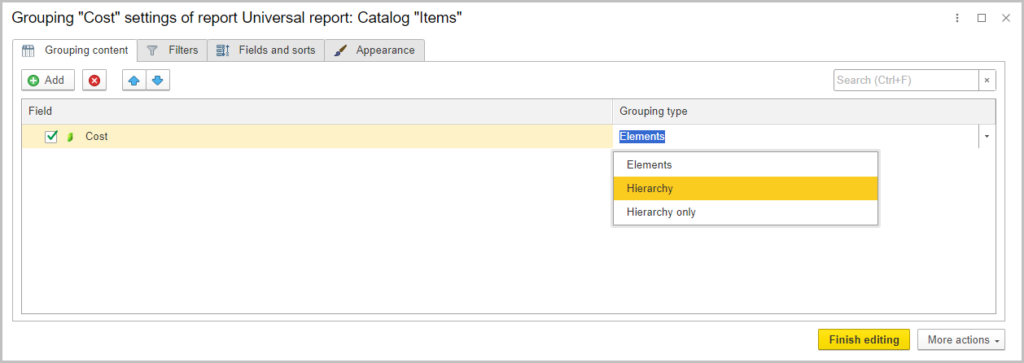
Grouping can be of the following types:
- Without Hierarchy: Only non-hierarchical records (elements) will be included in the grouping.
- Hierarchy: Both hierarchical and non-hierarchical records (elements and groups) will be included in the grouping.
- Hierarchy Only: Only hierarchical records (groups) will be displayed in the grouping.
If no grouping field is selected, detailed records—records retrieved from the database will be added to the report
Tables #
A table displays data in a tabular format. To add a table to the structure, use More actions → New table. Fields are used as the rows and columns of the table. To add a row or column click on it and then, when row or column is highlighted, click ![]() Add to add the necessary field.
Add to add the necessary field.
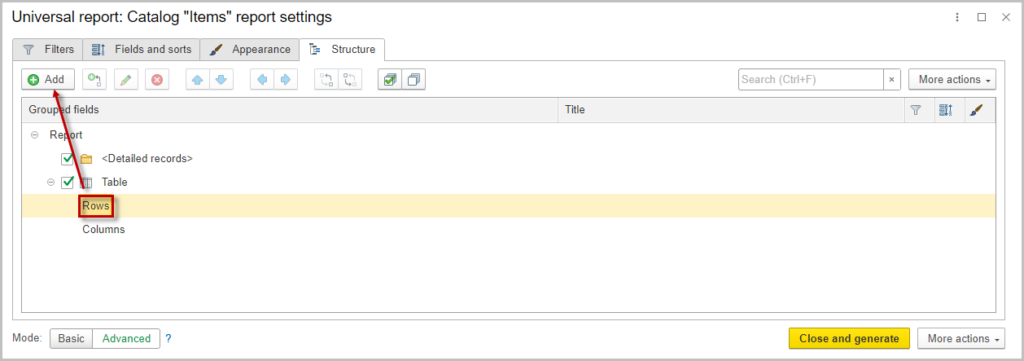
Charts #
A chart displays data in a chart format. To add a chart to the structure, use More actions → New chart. Depending on the chart type, add dots (X-axis) and series (Y-axis). Selected resources will be used as the chart values. Click on Dots or Series, then use ![]() Add to add a field to a chart.
Add to add a field to a chart.
To change the type of chart double-click on the Chart, in the following menu change the type of the graph
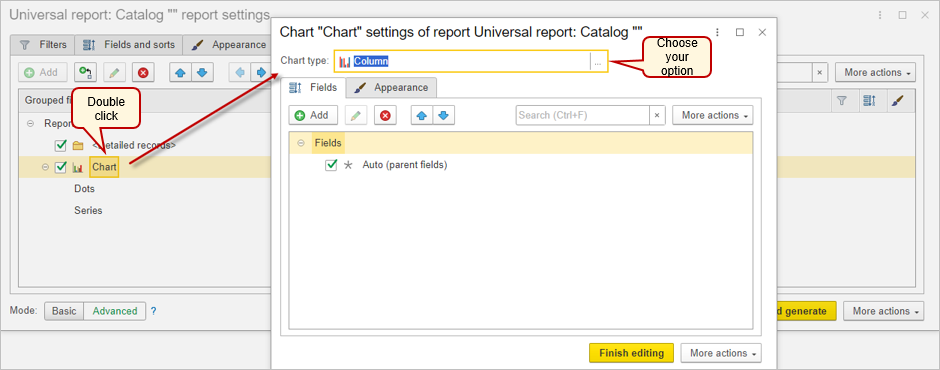
Our application provides next types of graphs:
- Column
- Bar
- Line
- Pie
- Area
- Dotted
- Surface
Exporting the entire database to Excel #
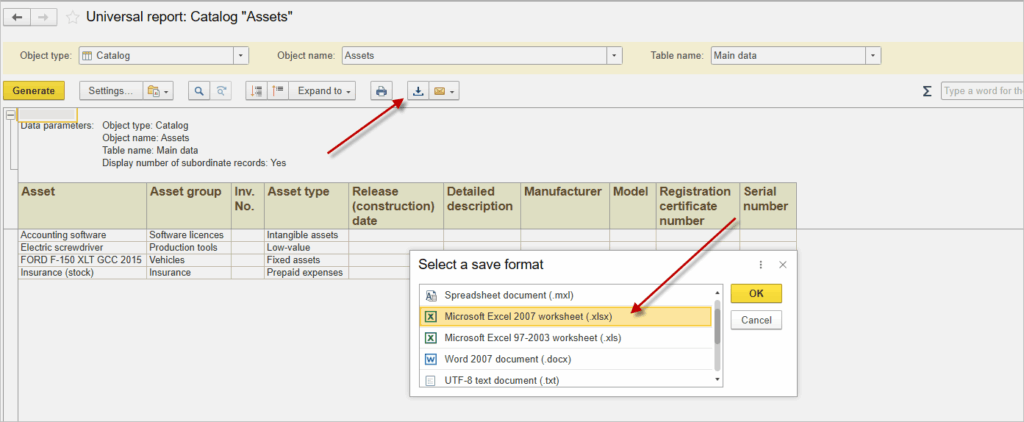
The Universal report allows you to download all the data from the database table by table as a spreadsheet documents and save it to Excel.
